

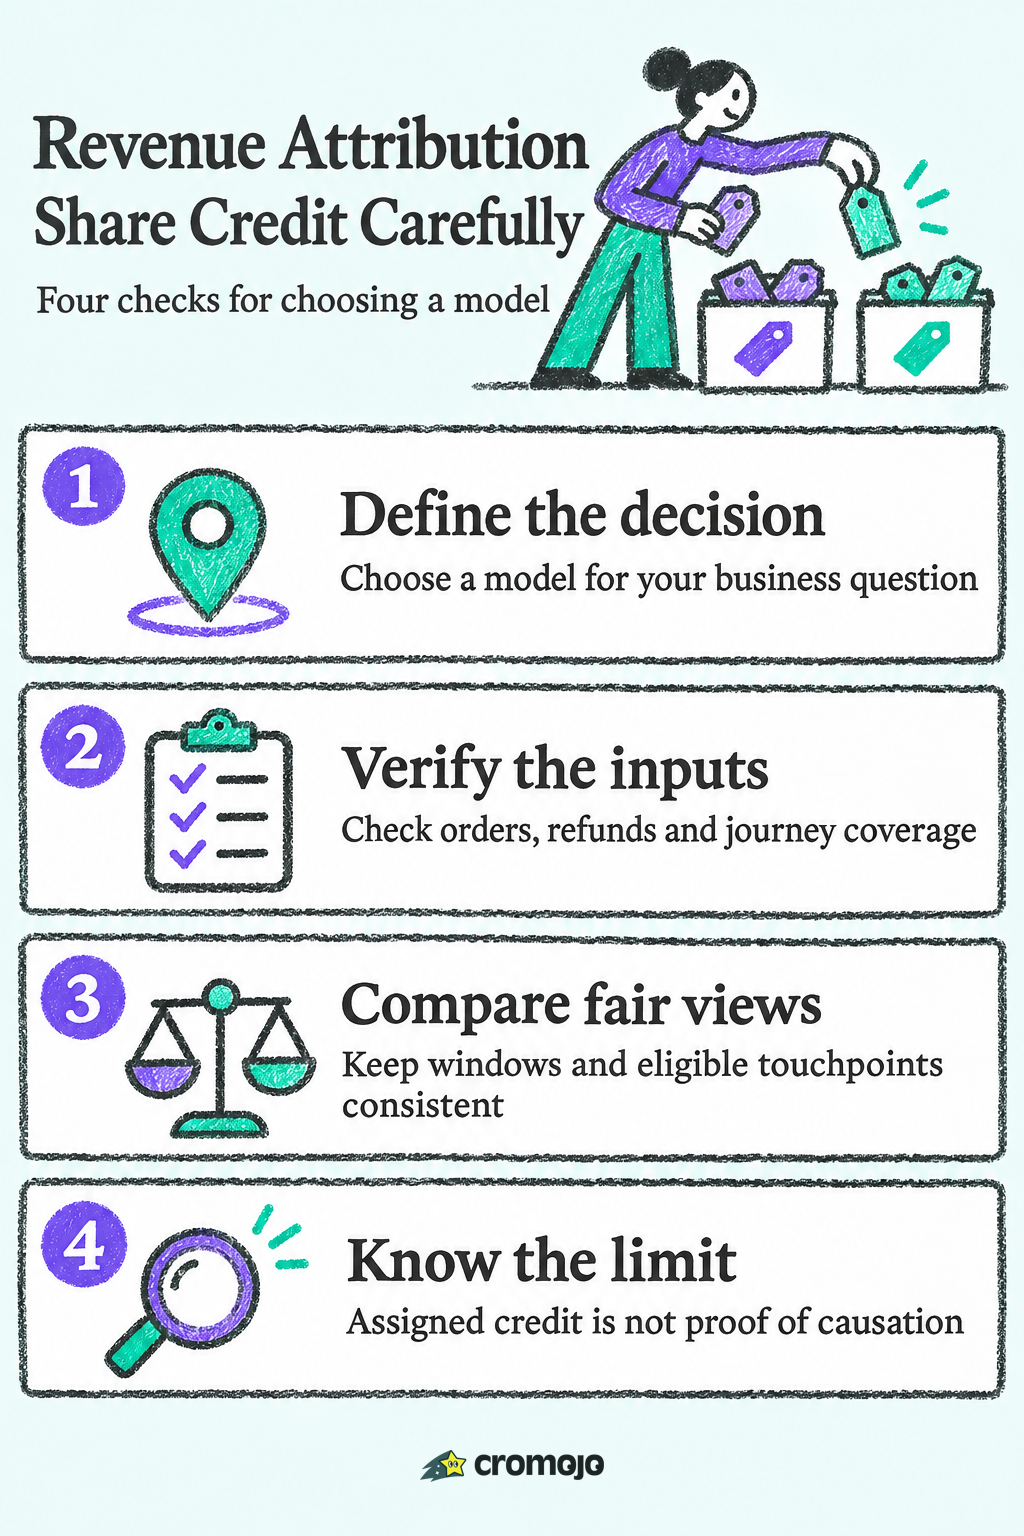
A revenue attribution model allocates recorded sales value across eligible marketing touchpoints using a rule or algorithm. First-touch and last-touch give one interaction all the credit; linear, time-decay and position-based rules split it. Choose around the decision, data coverage and supported reports. No model is universally best for small stores, and allocated credit is not proof of incremental revenue.
The rest of this guide shows how each model works with the same example order, where each one misleads you, and how to pick one without a data science team.
What revenue attribution actually measures
Revenue attribution is the practice of assigning revenue value to the marketing, sales and customer interactions that contributed to a purchase, following touchpoints from first awareness to the closed sale, according to NetSuite. The touchpoints can be email campaigns, social posts, paid ads, organic search visits and more, and the model assigns each one a value based on how much it is judged to have driven the sale, as Shopify describes it.
Two things are worth separating from the start:
- Conversion attribution asks which touchpoints led to a signup, a cart or a lead.
- Revenue attribution asks how many dollars each touchpoint is worth. It needs order values, not just conversion counts.
The second question is the one that changes budgets. Ten conversions from a channel mean little if they were $12 orders, and one conversion means a lot if it was a $900 order.
The example we will use for every model
To compare models fairly, imagine one customer who buys a $200 pair of boots from your store. Over three weeks, she:
- Finds your store through an organic search result for a product guide (day 1).
- Clicks an Instagram ad (day 8).
- Clicks a tagged promotional email link and visits the site (day 15).
- Clicks a retargeting ad (day 20).
- Types your address directly and buys (day 21).
These are five assumed observed, linked touchpoints within the same 30-day lookback window and one $200 order. The teaching examples include direct visits and credit each interaction once. Real tools can exclude direct visits, use different eligibility rules or miss cross-device activity; hold those settings constant when comparing.
Single-touch models
The two broad families are single-touch, which gives all revenue credit to the first or last touchpoint, and multi-touch, which spreads it across the tracked touchpoints, as NetSuite explains.
First-touch attribution
First-touch gives 100% of the credit to the first interaction. In our example, organic search receives the full $200.
Useful for: judging which channels bring new people in. It answers the question "where do customers come from?"
Where it misleads: it ignores everything that happened to convince her. An email program or retargeting campaign that closes sales would show zero revenue.
Last-touch attribution
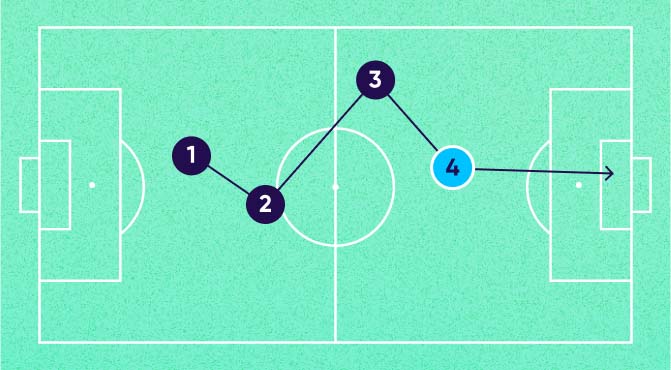
Last-touch gives 100% of the credit to the final interaction before purchase. In our example, that is the direct visit on day 21, so direct traffic gets $200 (many tools skip direct visits when other touchpoints exist, in which case the retargeting ad would receive it).
Useful for: short journeys, impulse purchases and cheap products, where the last click is usually close to the whole story.
Where it misleads: it rewards the channel that happens to be last, which is often branded search, direct or retargeting. Those channels collect demand that others created.
Multi-touch models
Linear attribution
Linear models distribute revenue credit evenly across every touchpoint in the journey, as Shopify notes. With five touchpoints, each gets 20%, or $40.
Useful for: a first look when you do not yet know which stage matters most, and for long consideration cycles where every interaction plausibly helps.
Where it misleads: it treats a passing ad impression the same as the email that prompted the purchase. It is fair but not discerning.
Time-decay attribution
Time-decay assigns more credit to recent eligible touchpoints. This worked example uses a seven-day half-life: weight = 2^(-days before purchase / 7), then divide each weight by the total. This is an illustrative calculation, not a current GA4 option. Round currency to cents and put the rounding remainder on the final touchpoint.
Applying that seven-day half-life to days 1, 8, 15, 20 and 21 gives the allocation below. Percentages are rounded for display.
Useful for: promotions and campaigns with a clear deadline, such as a seasonal sale, where recent interactions really do carry more of the decision.
Where it misleads: it undervalues the awareness channels that started the journey. If you follow it too strictly you may cut the content or ads that fill the top of your funnel.
Position-based (U-shaped) attribution
For this retail example, position-based means 40% to the first eligible interaction, 40% to the last and 20% shared equally across the three middle interactions. Other milestone-based definitions differ. A B2B lead-creation milestone is not automatically the same as an ecommerce purchase. These weights encode an assumption rather than discovering each interaction's causal contribution.
For our order:
The middle shares are exactly one third of 20%; displayed amounts allocate the one-cent rounding remainder to retargeting, so the order totals $200.
Useful for: stores that care about both discovery and closing, which describes most small ecommerce businesses.
Where it misleads: the middle of the journey, where email nurturing and comparison happen, gets little credit however well it works.
W-shaped and custom models
W-shaped models add a third milestone. In Shopify's B2B-style example, three milestones including opportunity creation receive 30% each and other touches share 10%, as the same guide explains. They matter mainly when you have a defined pipeline with stages, such as quote requests. Most online stores selling directly do not need them.

Data-driven attribution
Google's current attribution documentation, checked on 4 November 2026, lists data-driven, paid and organic last click, and Google paid channels last click in GA4 attribution reports. First-click, linear, time-decay and position-based are no longer selectable there. All current GA4 attribution models exclude direct visits unless the path is entirely direct, so their results differ from the simplified teaching examples above.
Data-driven attribution uses available path data and platform modelling assumptions. Review coverage, reporting scope and stability before acting. There is no universal monthly-order threshold that makes a rule better than an algorithm. Data-driven credit should still be checked against business outcomes and, where practical, controlled incrementality experiments.
Side-by-side comparison
How ecommerce stores can put this to work
Ecommerce businesses use these models to link activity such as social ads, email campaigns and paid search to actual sales revenue, which shows which channels drive the most conversions and guides future budget allocation, according to Shopify. Here is a practical way to get there.
1. Start with the length of your buying journey
Review the observed time to purchase, repeat visits and channels, while recognising that unlinked devices and missing events can shorten the apparent journey. Choose a supported baseline and compare alternatives with the same revenue definition, lookback window and touchpoint eligibility.
2. Make sure revenue is real, not estimated
A model is only as good as the revenue figure behind it. If your analytics counts a "conversion" with a fixed value, refunds, discounts and order size will all be wrong. Connect the analytics to the payment or store system, so that each order carries its actual amount.
3. Pick two models and compare them
Where your tool or export workflow supports it, compare two models over a period that covers the buying cycle and enough completed orders to assess stability. One month is not a universal minimum. Keep direct-traffic treatment, identity rules and windows consistent, and investigate channels whose assigned credit changes materially.
4. Check organic and net revenue
Two refinements are worth adding as you mature:
- Organic revenue: distinguish attributed organic landing-page sales from estimated organic keyword revenue. Search Console query aggregates are not an exact query-to-order identity link.
- Net revenue attribution subtracts refunds and returns from the credited revenue, so a channel that produces many returned orders does not look better than it is.
5. Change one thing at a time
When the numbers suggest shifting budget, move a modest share, wait a full buying cycle, and read the result before moving more. Attribution tells you where credit is likely due, not what would have happened without the spend.
Attribution models vs. media mix modeling
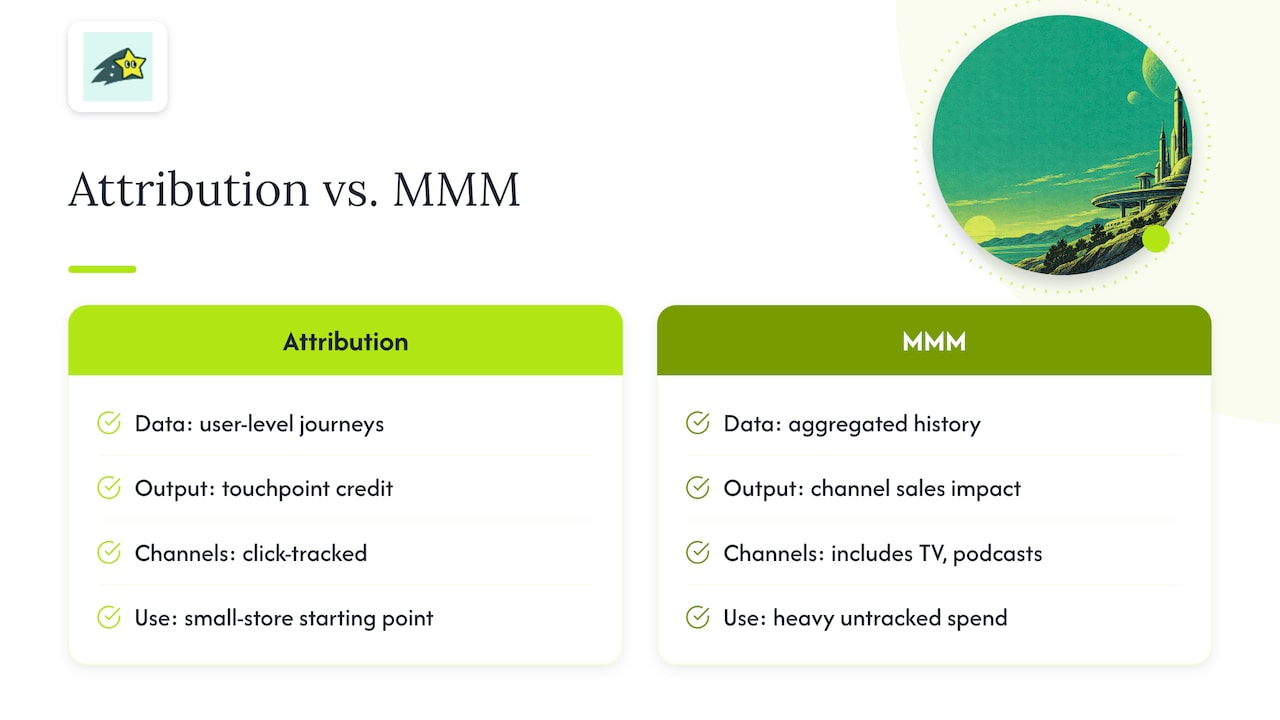
People often ask how attribution differs from media mix modeling (MMM). The short version: attribution models work from user-level, journey-based data to credit individual touchpoints. MMM is a statistical approach that uses aggregated historical data, typically over a long period, to estimate how each channel affects total sales. MMM can include channels with no click trail, such as TV or podcasts, but it needs a lot of history and produces slower, higher-level answers.
For a small online store whose marketing is mostly search, social, email and a few ad platforms, journey-based attribution is the practical starting point. MMM becomes worth considering when you spend heavily in channels that cannot be tracked click by click.
Privacy and data quality
Attribution depends on connecting visits to orders. Cookie restrictions, consent banners and browser tracking prevention all leave gaps in that chain. Two habits help:
- Review tracking modes, data minimisation and applicable consent choices. Cookie-free collection does not guarantee complete journeys, allow consent bypass or recover every declined visit.
- Tag your campaigns consistently with UTM parameters, so email, social and paid traffic do not get lumped into "direct."
A model cannot fix missing data. It can only distribute the credit for the data you have. If you want a wider view on why connected analytics improves marketing returns, this piece on analytics and marketing ROI covers the reasoning from awareness through purchase. For a practical look at how automation fits into campaign measurement, see this overview of AI campaign attribution.
Our perspective
Most attribution debates start with the model and end in a spreadsheet nobody trusts. We think the order should be reversed. Start with revenue you can verify, then choose a model.
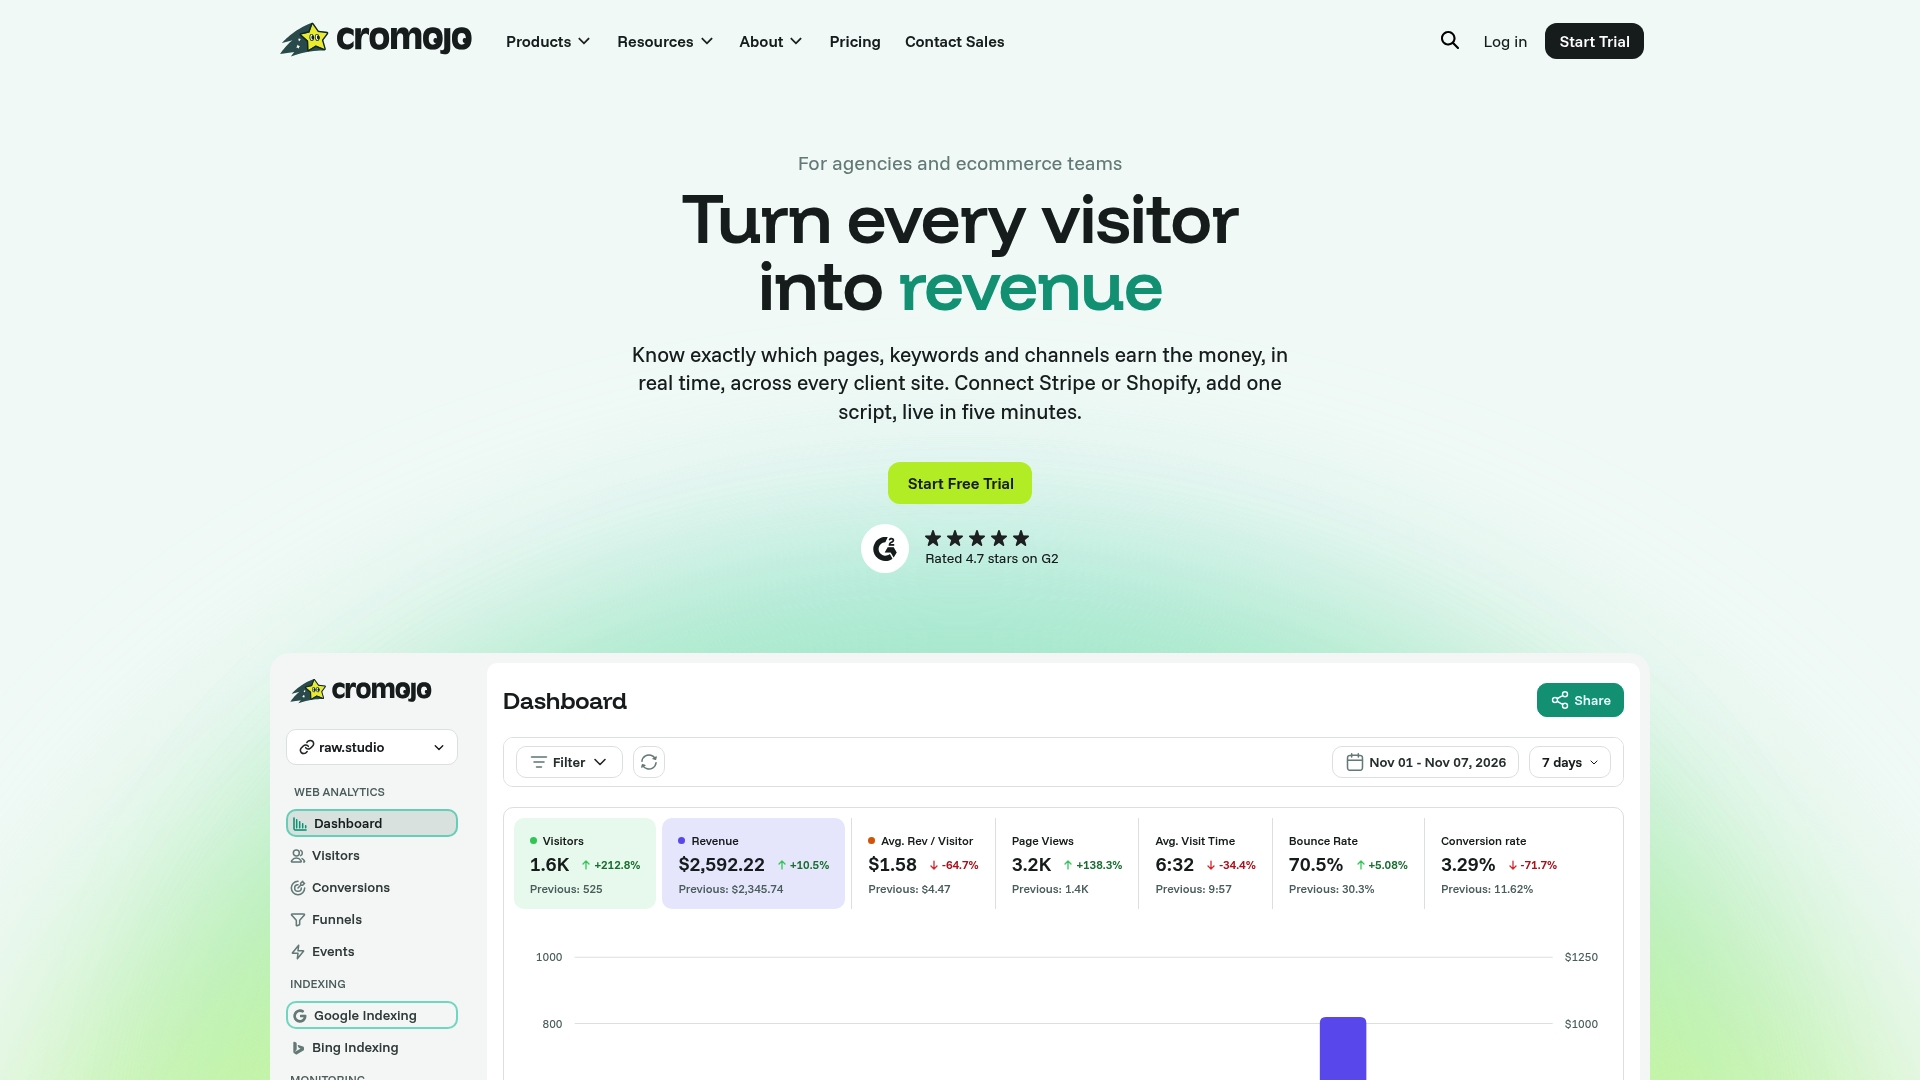
Cromojo connects recorded activity to eligible Stripe and Shopify purchases through a supported checkout reference. Page, source and campaign attribution can inform investigation; organic keyword revenue is estimated from Search Console. Actual order values improve the revenue input without proving the allocation rule is correct.
Configured monitoring and available insights can help surface issues, but coverage and timing depend on enabled checks, integrations and recorded data. Cookie-free and returning-visitor tracking modes have different storage behaviour. Review the configuration and relevant privacy choices; missing or unmatched activity remains possible.
Our advice is to start with verifiable order data and a clear decision, document a supported baseline, then compare assumptions. Keep unmatched revenue visible and use experiments to test major spending decisions. Revenue totals alone cannot settle which model describes causal impact.
See revenue by keyword, page and channel
Cromojo revenue analytics brings eligible Stripe or Shopify purchases together with recorded website activity. It offers attributed page, source and campaign sales, with estimated organic keyword revenue. Confirm the current reporting and matching behaviour for your setup; this guide does not establish that Cromojo offers a selector for every model illustrated here.
Compare current allowances, billing terms and tracking options on the pricing page. For help acting on findings, discuss the current scope of our conversion optimisation services.