


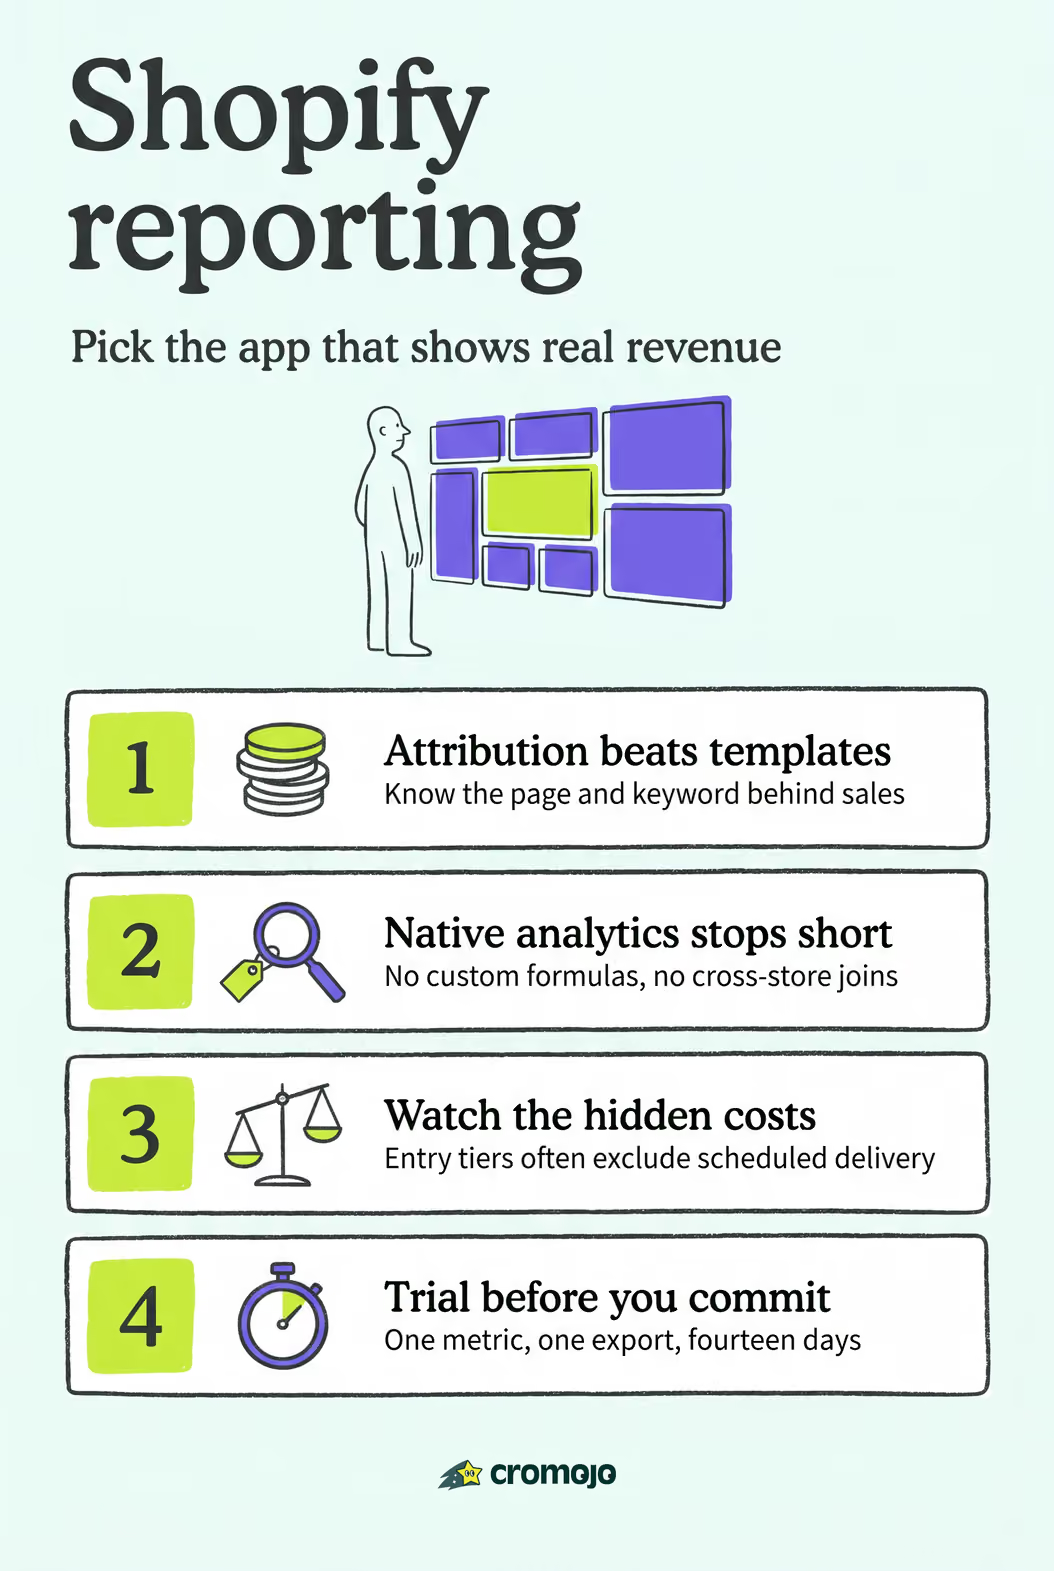
If you need one answer: try Cromojo first for revenue attribution by page, keyword, and channel, then shortlist Better Reports, Report Pundit, and Mipler for custom calculations and multi-store consolidation. Cromojo pairs Stripe and Shopify data directly, so you see which pages and campaigns actually generate revenue instead of just traffic. Better Reports and Report Pundit round out the shortlist with a large pre-built template library and free custom-report help. Mipler adds cohort analysis and multi-store aggregation for finance teams working with multiple storefronts. Shopify's own Analytics dashboard covers the basics well through ShopifyQL, but none of these gaps close without a dedicated app: custom metrics, scheduled exports, and cross-store joins.
Quick highlights to act on:
- Need to know which keyword drove yesterday's sales? Start with Cromojo.
- Need a report built for you, fast? Better Reports offers a complimentary custom-report service.
- Running multiple stores under one brand? Mipler consolidates them natively.
- Need tax or payout-ready templates? Report Pundit ships 150+ of them.
Key Takeaways
Revenue-first reporting beats template volume when your goal is knowing which page, keyword, or channel actually drove a sale.
Why Use a Shopify Reporting App Instead of Native Analytics?
A third-party reporting app earns its subscription the moment you need cross-store aggregation, custom metrics like COGS or ad-attributed revenue, or scheduled exports that land in someone's inbox every Monday morning; for ecommerce merchants, tools like Shopify SEO Automation can be pivotal when measuring organic channel revenue and SEO report needs. Shopify's native analytics has genuinely improved. It now surfaces daily ranked insights at the top of the dashboard with drill-down links, and Shopify Analytics offers ShopifyQL for advanced plans. But it stops short of blending Stripe fees, ad spend, and inventory history into one calculated view.
Where third-party apps add real value:
- Custom calculations (net profit after fees, LTV by cohort)
- Scheduled exports to Sheets, CSV, or email
- Multi-store or multi-currency consolidation
- Joins between ad spend and order data
- Historical inventory and returns reconciliation
Pro Tip:Before you subscribe to anything, time how long your current month-end reconciliation takes. If a reporting app can cut that by even an hour a week, it's already paying for itself.
What Features Actually Matter in a Shopify Reporting App?
Prioritize calculated fields, multi-store support, export scheduling, and onboarding help before you look at anything else. A pretty dashboard with no custom metrics just repackages what Shopify already shows you.
Checklist, ranked by how often it changes the outcome:
- Custom calculations and formula support: lets you reconcile returns, shipping credits, and COGS into a true net revenue figure.
- Multi-store and POS integration: avoids manual merging errors once you run more than one storefront or blend online with in-person sales.
- Export and scheduling: CSV, Google Sheets, and PDF delivery on a cadence you control, not one you remember.
- Onboarding or custom-report service: someone who builds your first report so you're not staring at a blank query editor.
- Historical and multi-currency support: matters the moment you expand into a second market or need a year-over-year view.
On implementation cost, watch for data volume caps, per-store add-on fees, and whether "unlimited reports" quietly excludes scheduled delivery on the entry tier. Mipler and Report Pundit both publish tax and payout-ready templates, but those often sit behind a mid-tier plan rather than the base one.
Which Columns Matter Most When Comparing Reporting Apps?
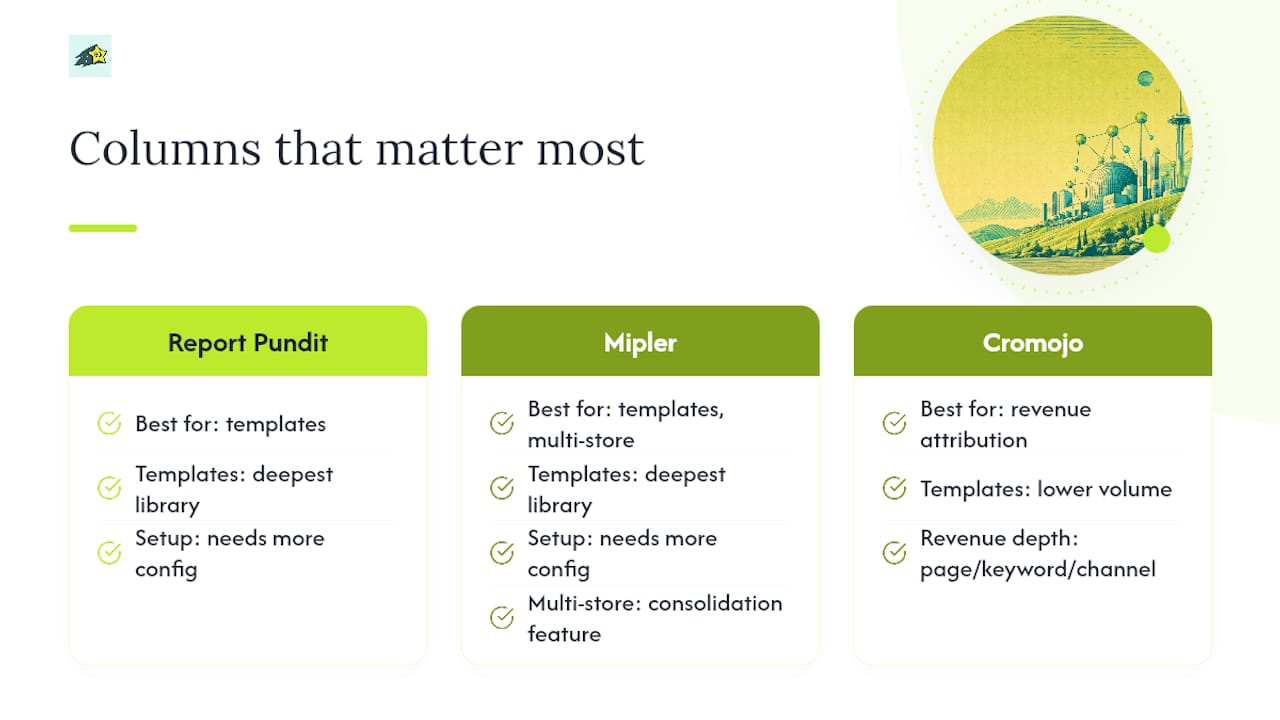
The single column worth checking first is "best for," because a tool built for inventory ops will underperform for revenue attribution no matter how many pre-built reports it ships.
A few trade-offs stand out. Apps with the deepest template libraries (Report Pundit, Mipler) sometimes ask you to configure more before your first report is genuinely useful. Cromojo trades template volume for depth on one job: telling you which page, keyword, or channel actually produced revenue. Multi-store consolidation, per Mipler's own listing, is a feature merchants routinely underestimate until they've already opened a second store.
Which Shopify Reporting App Fits Your Use Case?

Cromojo leads this list for merchants who need to know where revenue actually comes from, not just where traffic lands. It attributes real-time revenue by page, keyword, and channel, connects directly to Stripe and Shopify, and tracks visitors without cookies. Setup takes minutes rather than a configuration sprint, which matters if you don't have a data analyst on staff. What to verify in a trial: confirm your Stripe payout timing matches what the dashboard shows before you trust the numbers for a board report.
Better Reports is built for merchants who want a human to help them get unstuck. Its free custom report service builds your first complex report at no extra charge, and exports cover PDF, CSV, and Google Sheets. Best for teams that want flexibility without learning a query language. Red flag to test: ask how fast their support responds to a custom-report request during a trial, since that turnaround varies.
Report Pundit ships over 150 pre-built templates, many aimed at accountants and bookkeepers who need tax or payout-ready output. It supports multi-store reporting natively. Best for merchants who'd rather pick a template than build one from scratch.
Mipler targets finance and operations teams juggling more than one storefront. It offers no-code custom reports, cohort analysis, forecasting, and over 100 pre-built reports, with scheduled exports to Sheets. Best for multi-brand operators who need consolidated numbers without spreadsheet gymnastics.
Report Toaster adds an AI report builder on top of 100-plus templates, with scheduled delivery to email or Slack. Good for teams that want a starting draft generated for them, then refined.
EZ Exporter focuses narrowly on export automation, letting you build custom CSV or Excel layouts on a schedule. It suits accounting teams with specific formatting requirements rather than merchants who want dashboards.
Data Export Reports and its close relative Data Export Reports (Data Export IO) both center on scheduled exports to spreadsheets, useful if your workflow already lives in Google Sheets or Excel.
Reportgenix and DeepMine cover sales analytics with filtering and scheduled delivery, aimed at stores that want recurring summaries sent to a team channel rather than an interactive dashboard.
Lebesgue: AI CMO and ThoughtMetric lean toward marketing performance, generating AI-assisted insight summaries or channel-level alerts for teams tracking ad efficiency.
Easy Reports, Best Sellers - Insights & more, and By the Numbers serve smaller stores that want quick, simple exports without a learning curve.
Vendor Payout, TrendSeam Sales Reporting, Email Reports by Ablestar, edrone, and Error Tracking with CatchJS each solve a narrower problem: vendor payout splits, scheduled sales digests, marketing automation reporting, and site error monitoring, respectively. Worth a look only if that specific need is your bottleneck.
How Do You Choose the Right Reporting App During a Trial?
Pick the app that answers your top three operational questions inside a 14-day trial. If it can't, move on.
- Days 1 to 3: Pull a sample of your last 30 days of orders and check whether returns and cancellations are handled the way your accountant expects.
- Days 4 to 7: Build one custom metric, such as net profit after Stripe fees, and confirm the formula editor can actually do it.
- Days 8 to 14: Test a scheduled export end to end, and if you run more than one store, confirm multi-store consolidation works without manual merging.
Questions worth asking vendor support directly: How far back does historical data go? Is there API access for custom integrations? What's the SLA for scheduled exports that fail silently? How is customer data handled for privacy compliance? Are overage fees clearly published, or do they show up later?
Red flags that should end a trial early: inconsistent returns handling between reports, exports that take hours to generate, no way to create a calculated field, and pricing pages that hide tier limits until checkout.
Which Reports Should You Build First?
Six reports deliver most of the value from any reporting app, and building them in this order gets you to a usable dashboard fast.
- Sales by channel, returns-adjusted: subtract refunds and cancellations so the number reflects real revenue, not gross bookings.
- Inventory aging: flag stock sitting past 60 or 90 days before it turns into a write-off.
- Product-level profitability: fold in COGS, shipping cost, and payment fees, not just the sale price.
- LTV by cohort: group customers by acquisition month to see which cohorts actually stick around.
- Ad spend attribution: match spend to the page or keyword that converted, echoing the leading-indicator approach Shopify itself recommends for KPI dashboards.
- Fulfillment performance: track time from order to ship, since slow fulfillment quietly erodes repeat purchase rates.
Pro Tip:Start by exporting each report to Google Sheets daily for a week before building a permanent dashboard. It's the fastest way to catch a broken calculation before it becomes the number your team trusts.
When Should You Pick a Lightweight Tool vs. a Full BI Stack?
A lightweight exports-first app works fine if your only need is a clean CSV on a schedule. A full BI stack earns its complexity once you're joining five data sources and need an analyst to maintain it. For most merchants in between, a revenue-first platform like Cromojo hits the sweet spot: enough calculated depth to trust the numbers, without the setup burden of a BI project. Trial each option against your own data before committing, and pay close attention to how much onboarding support you actually get on day one.
Try Cromojo for Revenue-First Shopify Reporting
Cromojo gives you attribution the other apps on this list treat as an afterthought: real revenue tied to the exact page, keyword, and channel that produced it, pulled straight from your Stripe and Shopify data.
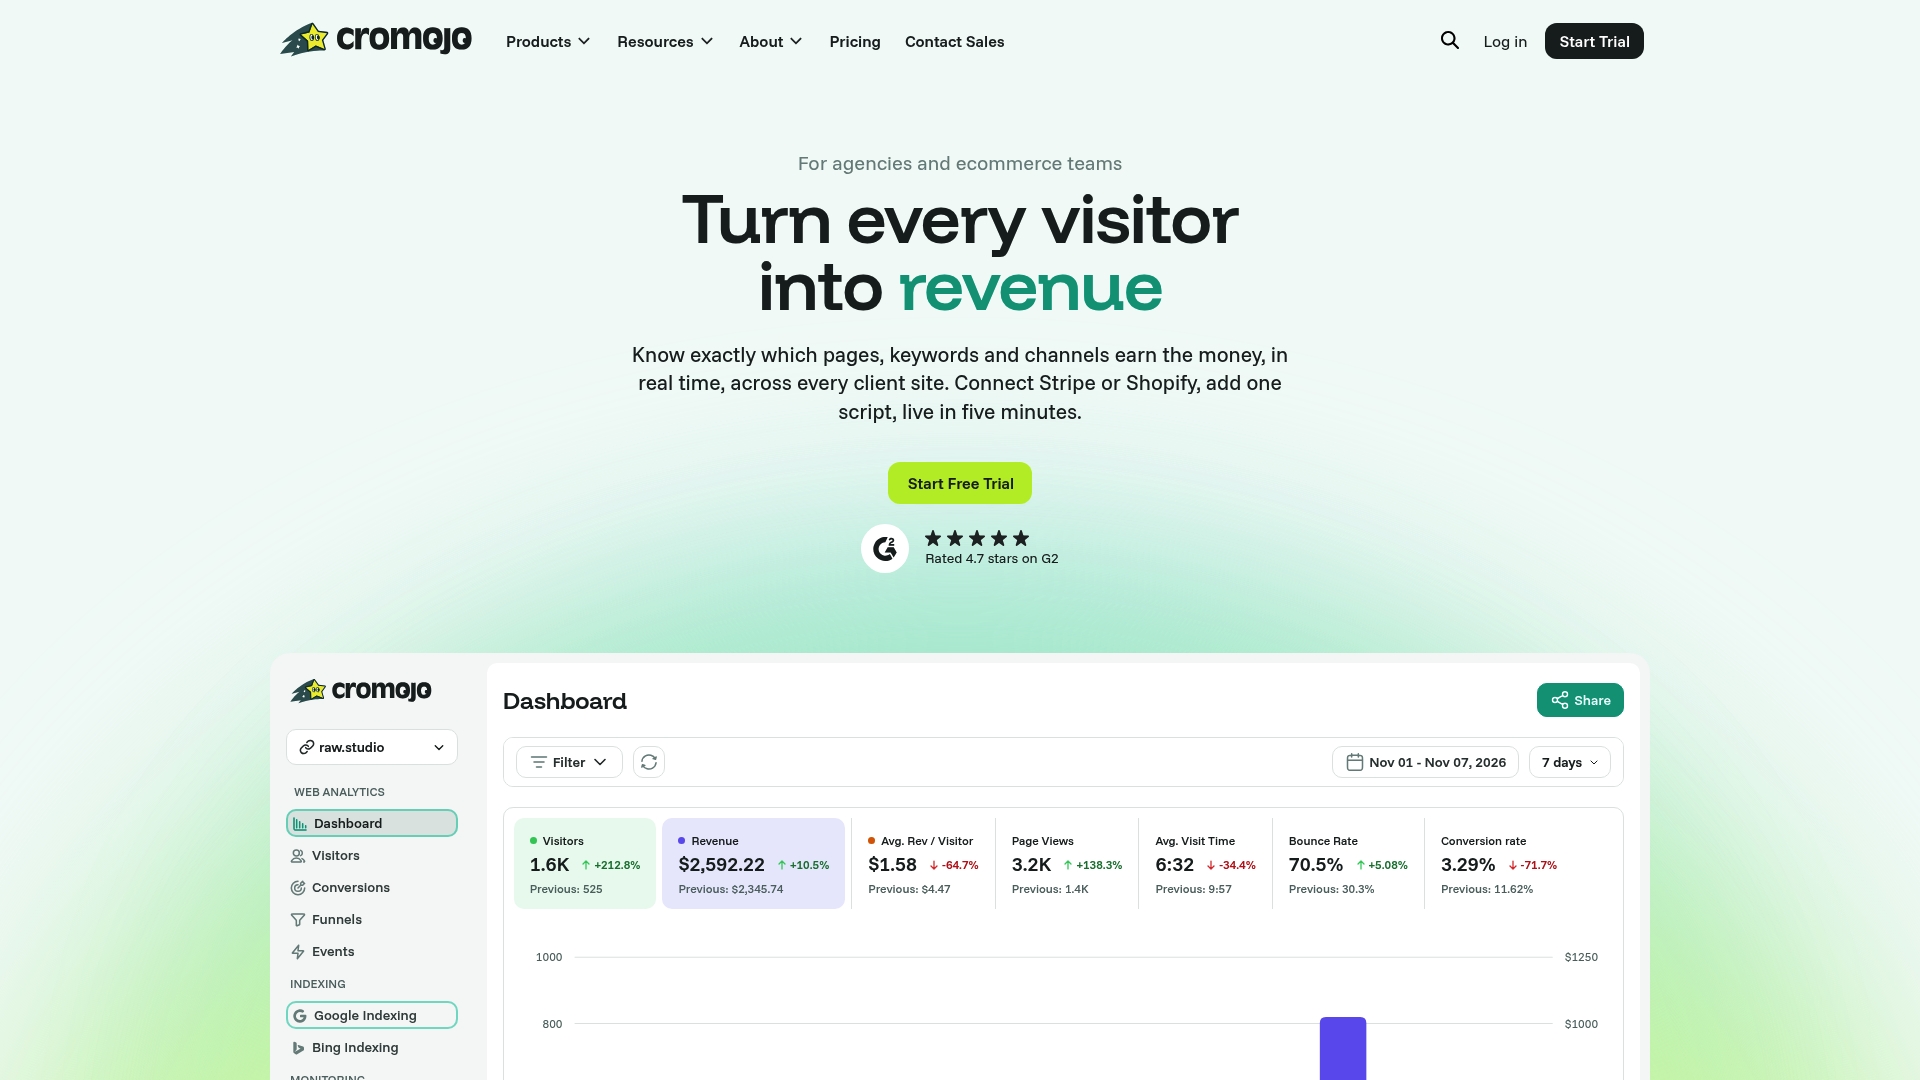
Two things make it worth a trial run. First, tracking is cookieless, so you get accurate visitor journeys without the privacy overhead or consent-banner friction other tools carry. Second, setup takes a lightweight script and minutes, not a configuration project. If you've read this far because your current reports tell you what sold but never why, that gap is exactly what Cromojo's revenue attribution closes. Start a free trial and connect your store to see your first attributed revenue report today.