
The best customer journey analytics software for a small business, ecommerce store or agency is the one that connects what visitors do to the revenue they produce. Cromojo is built for exactly that: it ties funnels, visitor journeys and session replay to Stripe and Shopify revenue, so you see which pages, channels and keywords lead to paid orders, not just clicks. Enterprise suites and product analytics tools cover other needs, and this guide shows where each fits.
What customer journey analytics actually is
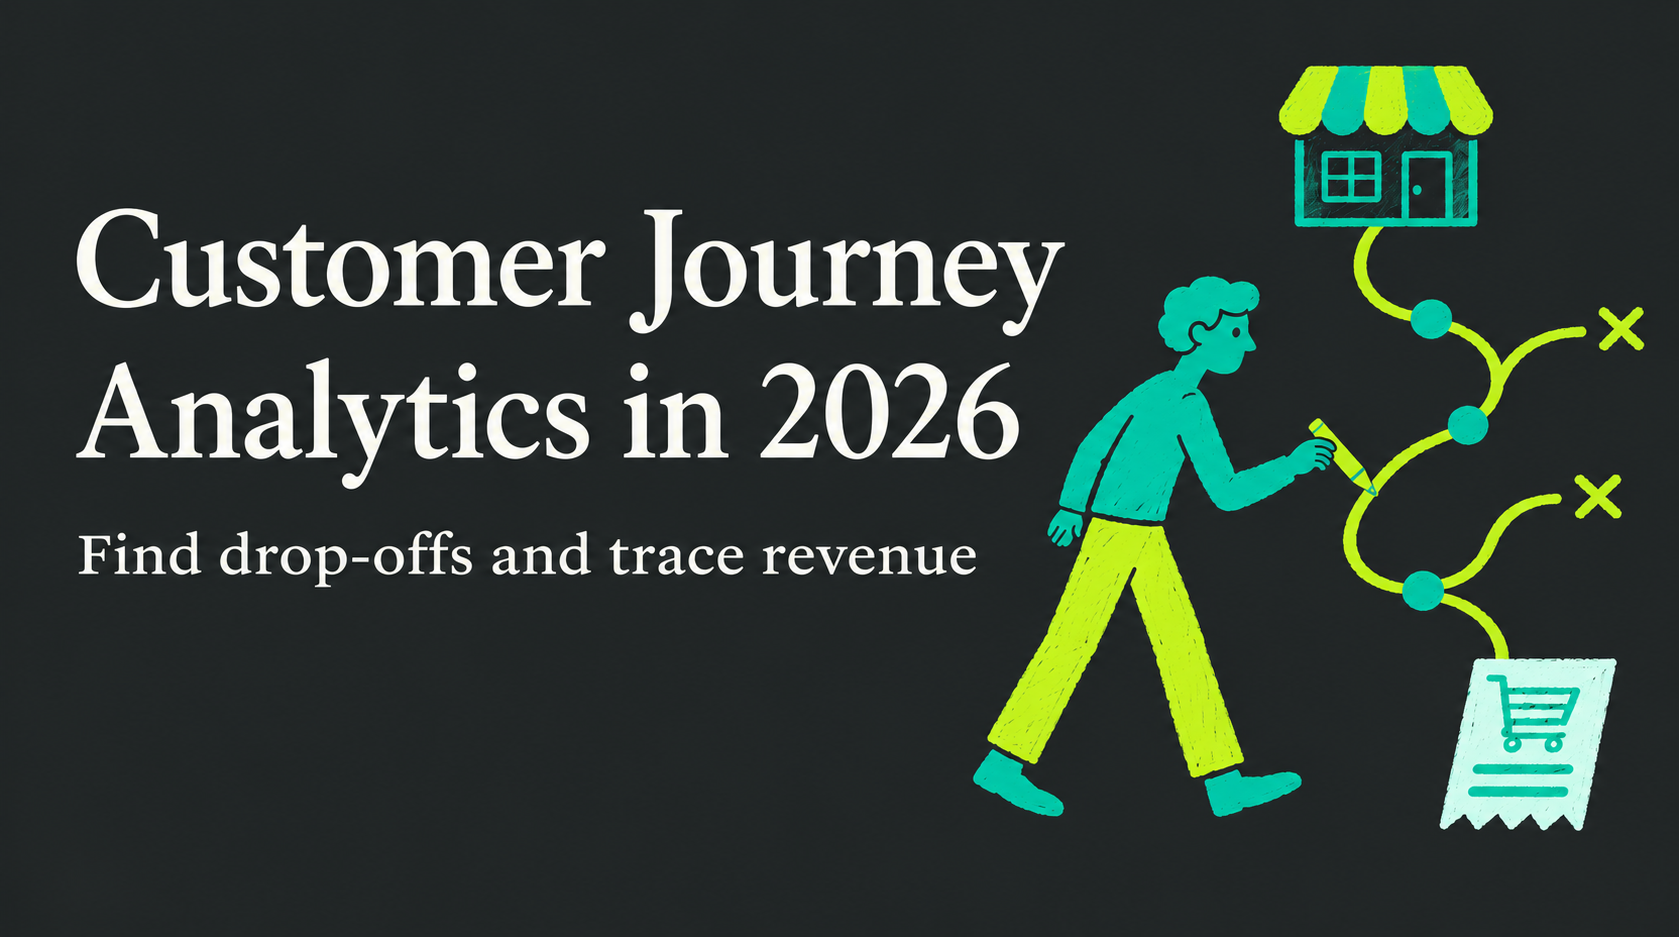
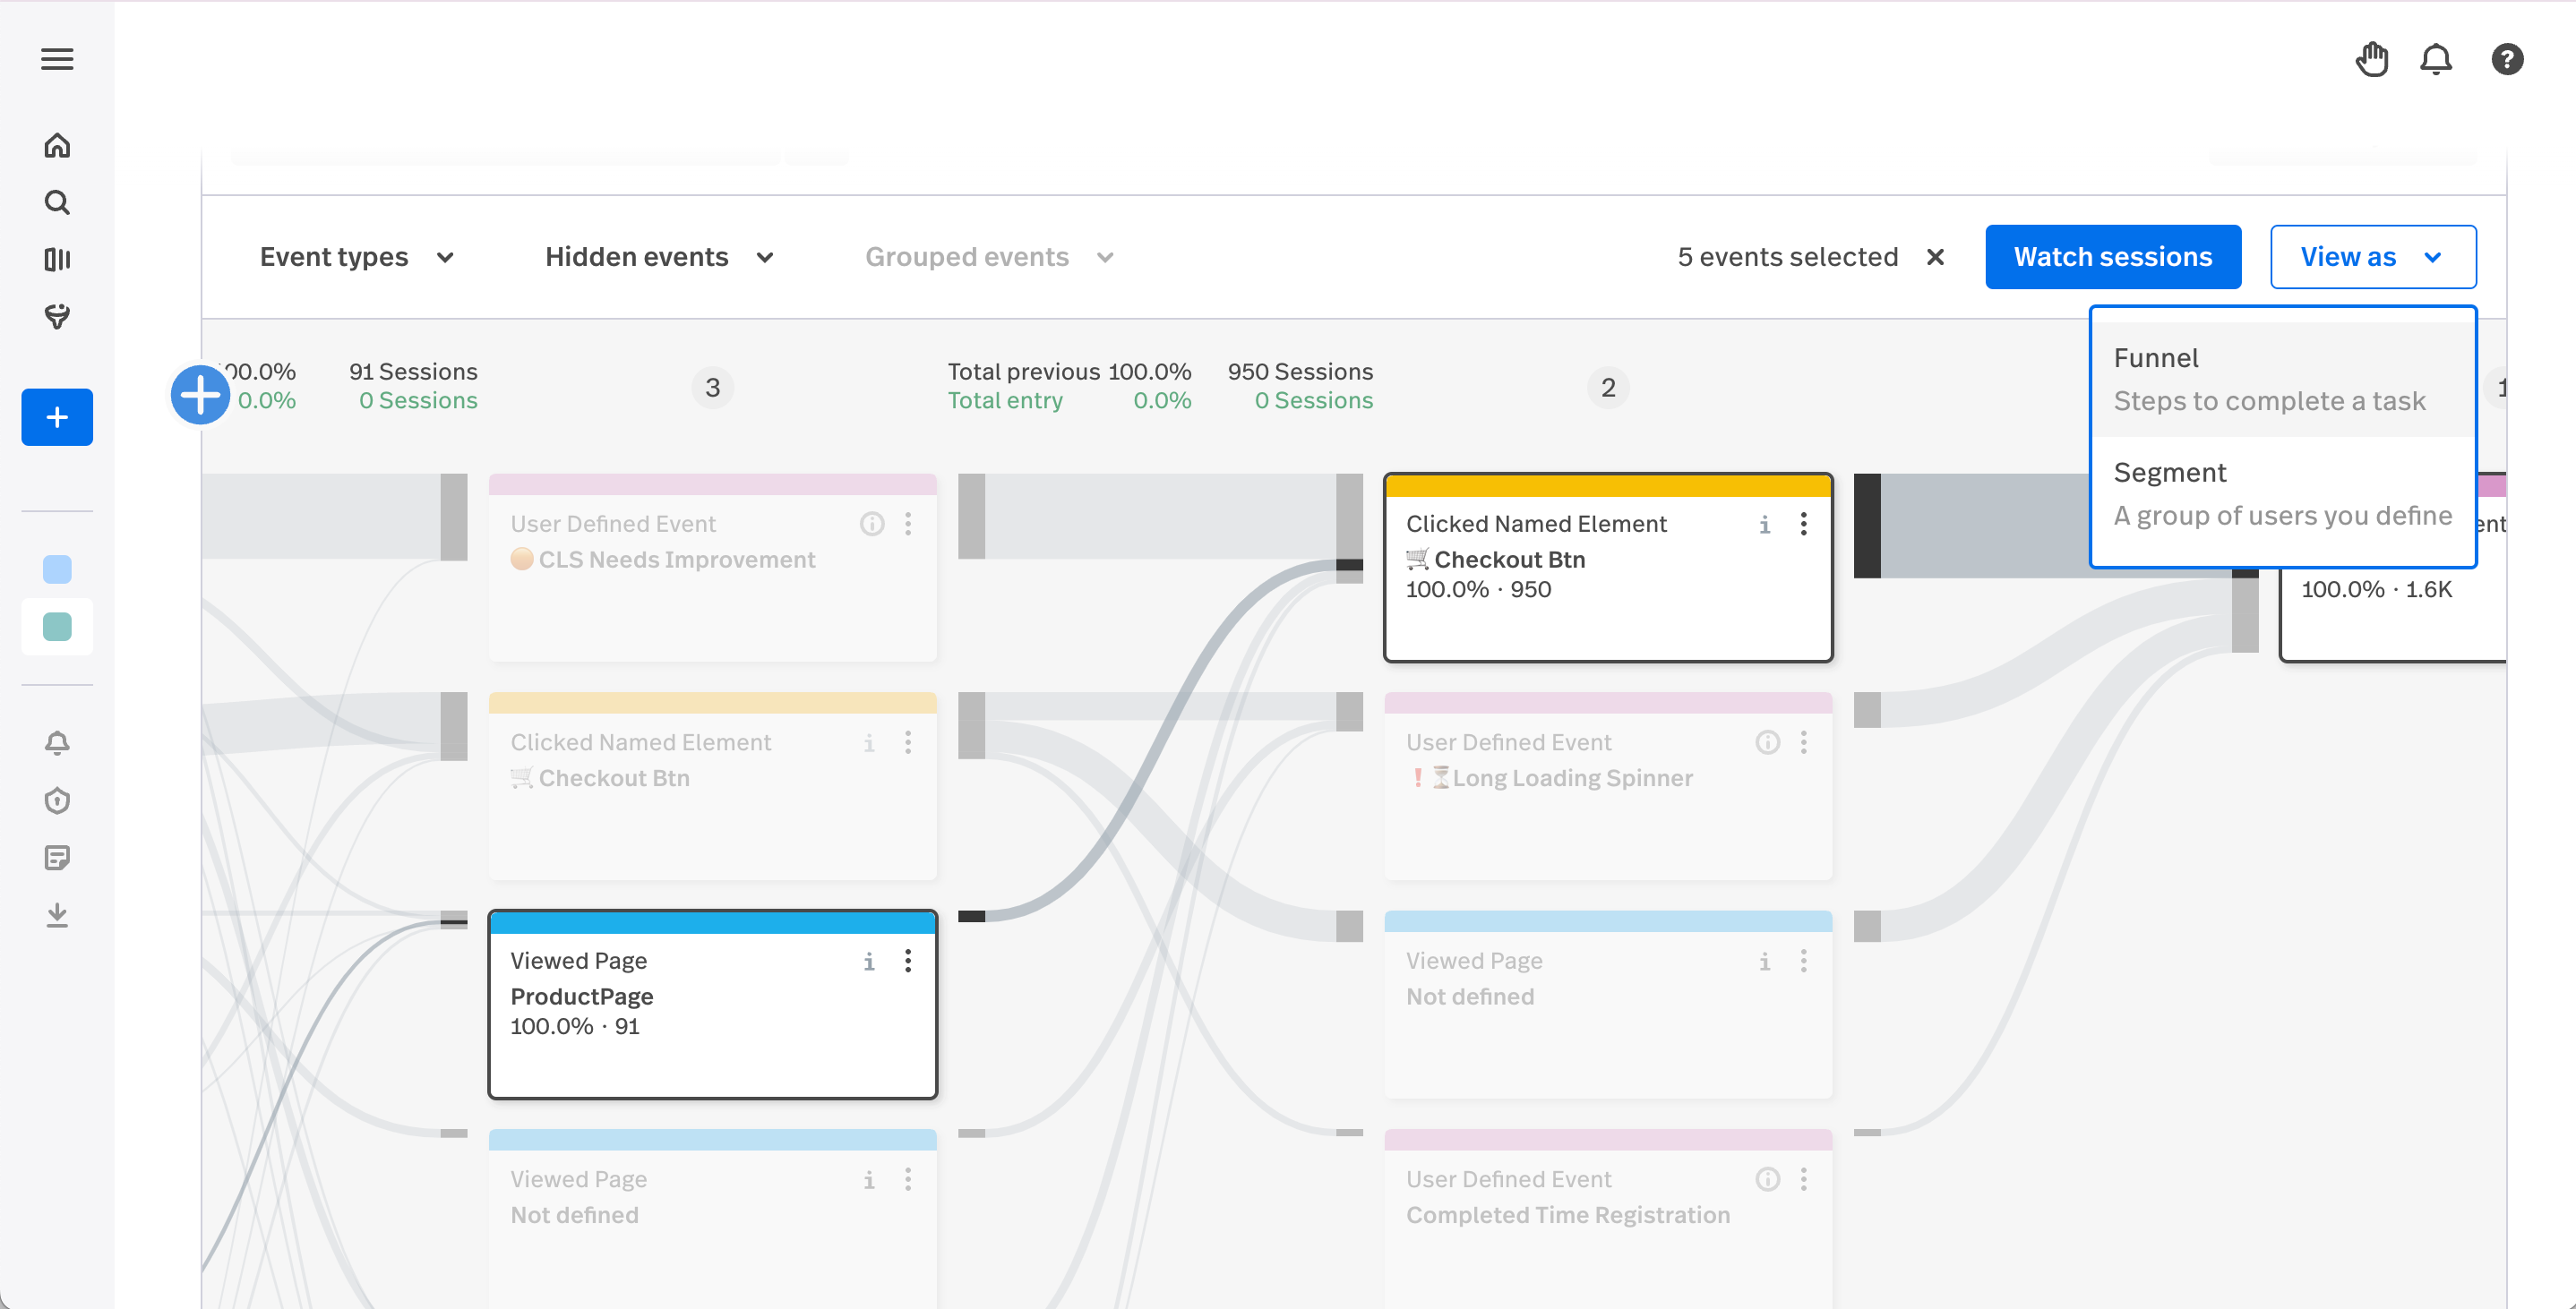
Customer journey analytics tracks the steps a person takes before they buy, sign up or leave, and links those steps together even when they span several visits, devices or channels. The goal is to answer questions such as: which route do paying customers take, where do they drop off, and which campaigns started the path?
It differs from two things people often confuse it with. Conventional web analytics platforms and heatmap tools report page views and clicks, and are typically limited to a single session or channel. Customer data platforms focus on collecting data and resolving identities rather than analyzing the journeys themselves, as CMS Wire explains. Journey analytics sits between the two: it takes the raw behavior and turns it into routes you can act on.
Journey mapping is something else again. A map is a diagram a team draws from research and assumptions. Analytics is built from what visitors actually did on your site.
What to look for before you compare
The tools that rank for this keyword range from enterprise suites to lightweight dashboards, so a feature checklist alone misleads. G2 analyst Devyani Mehta, in a 2026 review of journey analytics software, prioritizes tools that support several analysis methods: journey mapping, funnel analysis, path exploration, cohort tracking and real-time behavioral insights. She also favors automated insight generation and anomaly detection, which move a team from raw data to a decision.
For the readers of this guide, small business owners, ecommerce marketers and agencies, five criteria matter most:
- Revenue connection. Can you see money, not just sessions, at each step of the journey? A funnel that stops at "added to cart" leaves out the number you care about.
- Funnel and path coverage. You need to measure drop-offs between steps (funnels) and see the routes people take before converting or leaving (path analysis).
- Setup effort. A tool that needs a data engineer to define every event will sit unused in a small team.
- Privacy and tracking method. Cookieless, first-party tracking avoids consent-banner gaps in your data.
- Pricing that scales. Look at what you pay at your actual traffic, and at what happens when you add a second site or a tenth client.
Customer journey analytics tools compared
The table groups the options you will meet most often. Prices come from the published comparisons linked in the next sections, and the plans change, so confirm them on each provider’s site.
Cromojo: the pick for revenue-focused journeys
Most journey tools answer “what did visitors do?” Cromojo answers “what did visitors do that made money, and where did the money leak?” That is why it is our recommendation for ecommerce stores, small business owners, marketing teams tracking ROI and agencies.
Here is what it covers, using the features on its product pages:
- Revenue Analytics attributes revenue by keyword, page and channel in real time, with Stripe and Shopify integrations, so revenue appears next to behavior.
- Funnels show where visitors drop out between steps, and User Journeys show the routes they take through the site.
- Goals and Custom Events let you define what counts as a conversion for your business.
- Session Replay lets you watch what happened at the step where a funnel loses people.
- Smart Insights uses agents that continuously monitor performance and point to specific conversion gaps and opportunities, with tailored recommendations, so you do not need to dig through reports.
- SEO Revenue connects Google Search Console data to revenue, which matters when search visibility is part of your job.
- First-party Tracking is cookieless and privacy-first, with minimal setup on any tech stack.
The platform also includes website monitoring for downtime, errors and SEO health, plus automated indexing and re-indexing for Google, Bing, Yandex, Baidu and AI search. For a small team, that means journey analysis, site health and indexing sit in one subscription rather than three.
Plans are tiered by pageviews and tracked sites, with overages billed per 1,000 additional pageviews. Starter is $19 per month, Pro is $49 per month, Business is $129 per month and Agency is $299 per month. There is also a Free Plan, and paid plans follow a free trial. See the pricing page for what each tier includes.

Enterprise suites: Adobe, Contentsquare and others
If your company has a data team and several business units, the enterprise suites are what analyst lists tend to feature. Adobe Customer Journey Analytics, which tops the search results for this keyword, is sold as an enterprise licence with no published prices, according to The Knowledge Engineers’ 2026 comparison. That comparison also reports Contentsquare’s free plan at 200k sessions with a 15-day trial of its Growth plan.
G2’s list of the ten best customer journey analytics tools reaches further into marketing automation: HubSpot Marketing Hub for journey analytics inside a CRM, Insider for AI-driven personalization, Braze for real-time cross-channel engagement, Glassbox for session replays and friction points, Dotdigital for ecommerce journey automation, and ChurnZero for customer success journeys. Those tools suit teams whose main job is messaging customers across email, mobile and in-app channels.
If your question is instead “which of my pages, keywords and campaigns earn revenue?”, a revenue-first platform gets you to the answer with far less configuration.
Product analytics tools: Amplitude, Mixpanel, PostHog
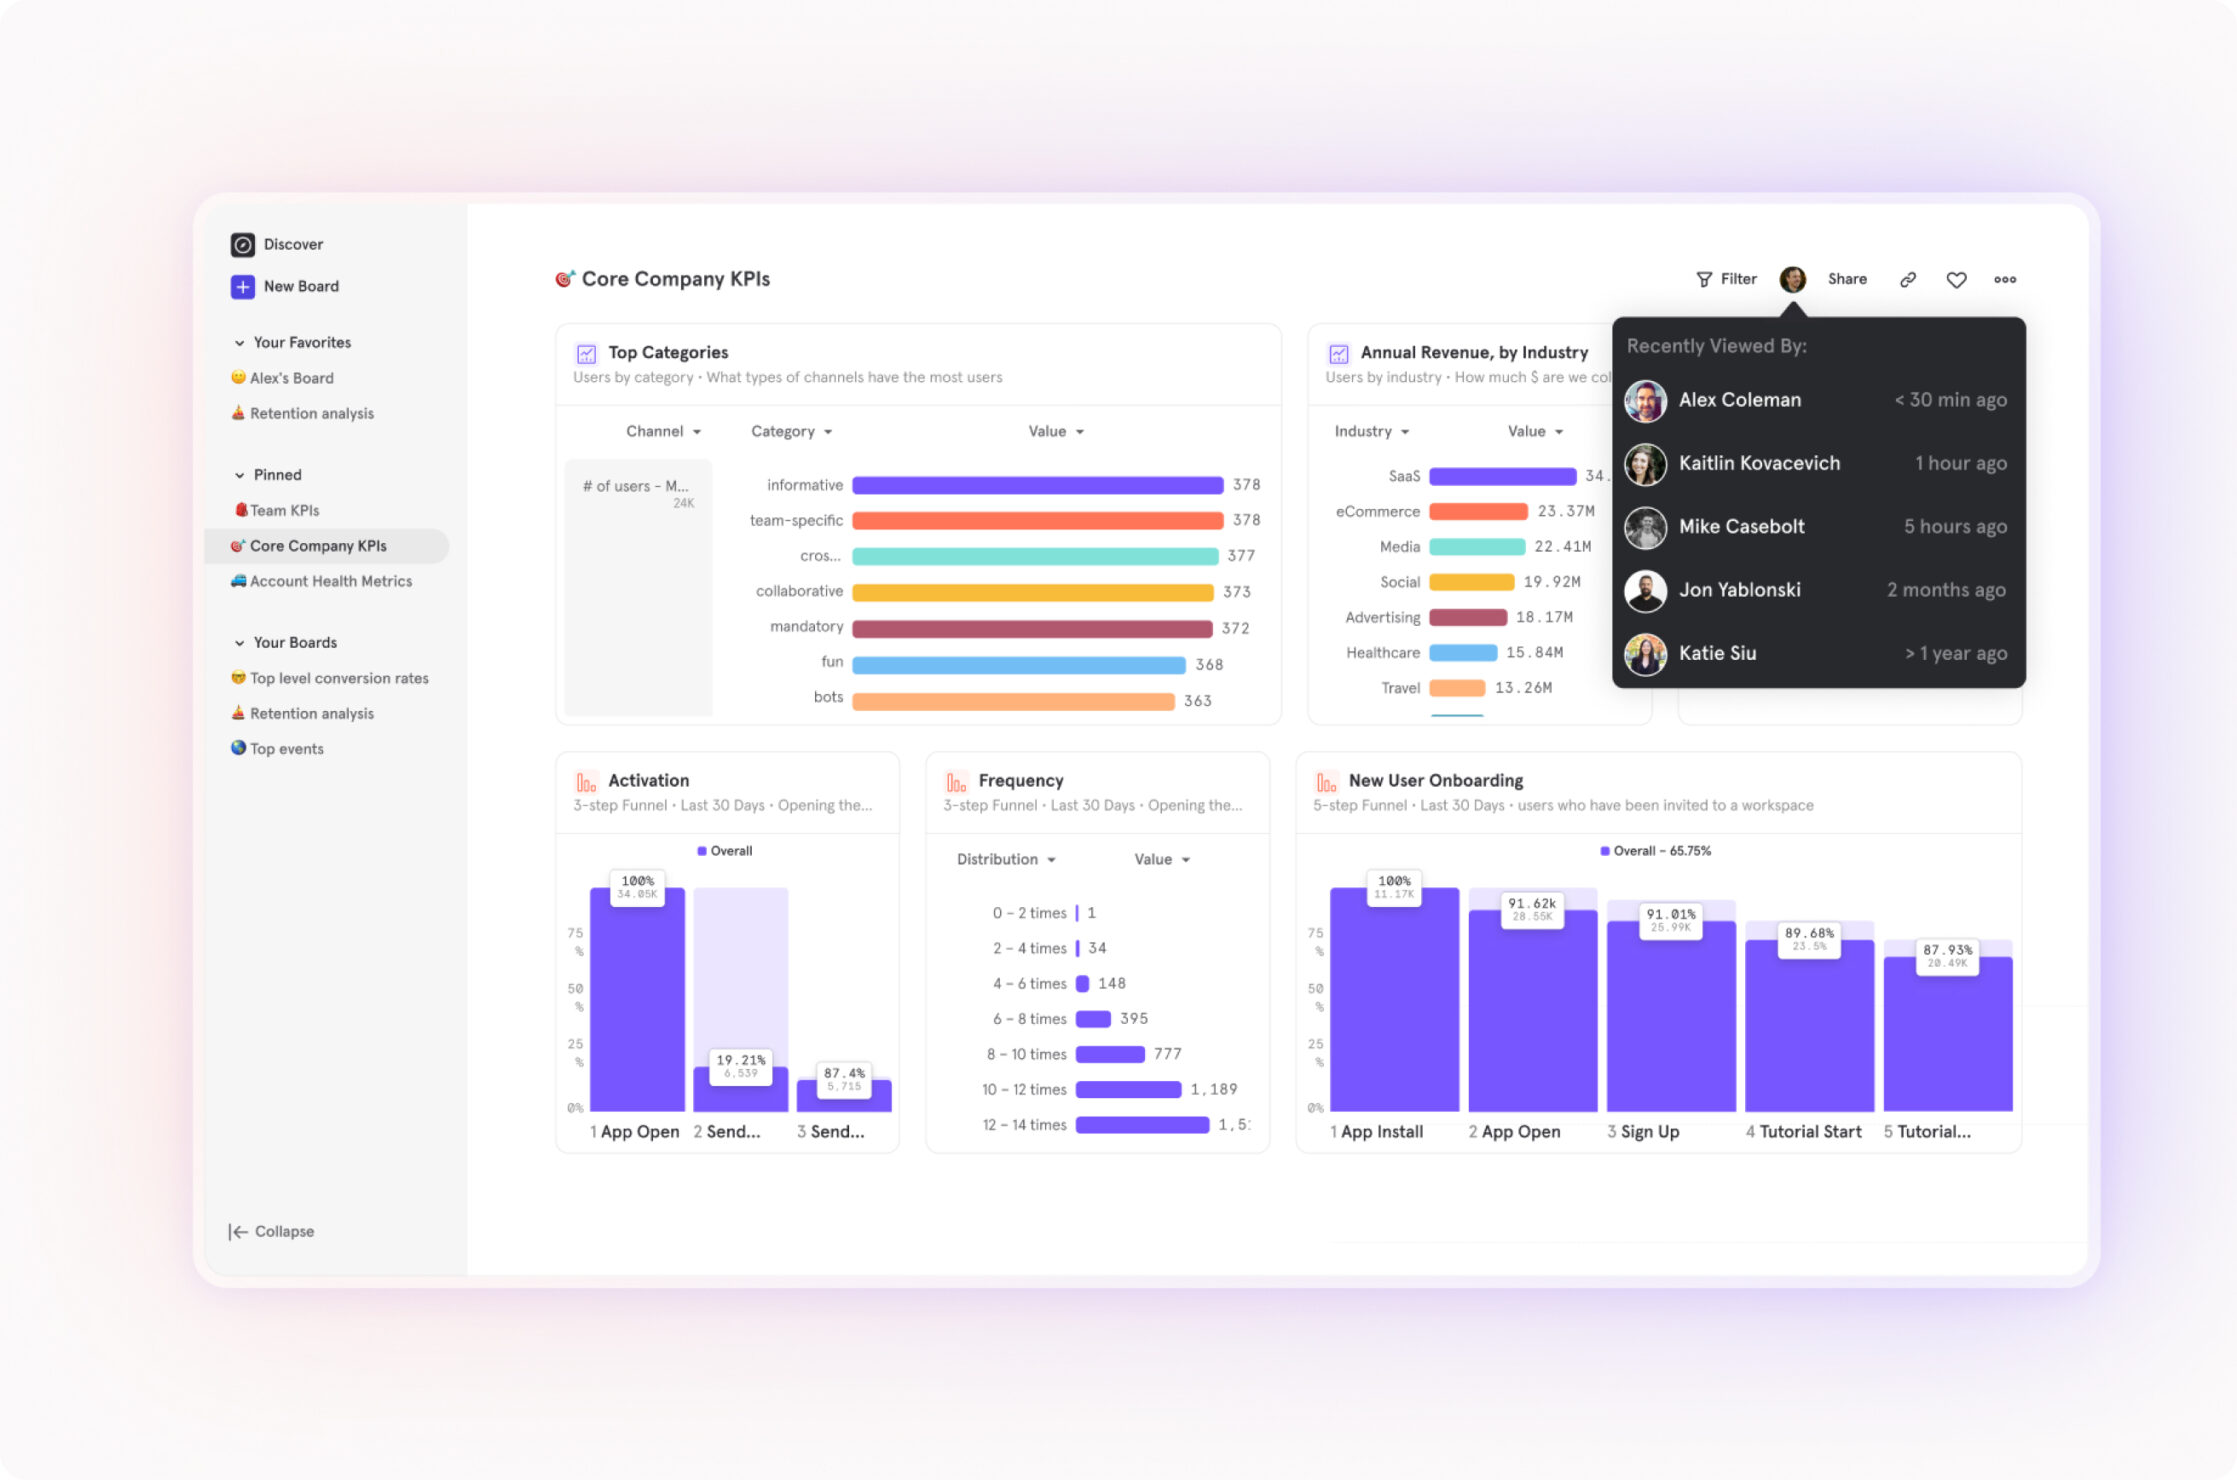
Product analytics platforms are strong at event-level funnels and paths inside an app. The Smarter Ranking 2026 comparison, published November 2025, scores PostHog first (free to 1M events, then usage-based), Amplitude second (free, with a Plus plan at $49 per month), Mixpanel third (free, then usage-based Growth), Heap fourth (free up to 10k sessions), Matomo fifth (free self-hosted, or €29 per month) and Usermaven sixth ($14 per month for 100k events).
The same source notes that Mixpanel’s Growth plan charges about $0.28 per 1,000 events after the first million, which puts 10 million events near $2,520 per month. The Knowledge Engineers report that Amplitude’s free plan includes 2M events per month, 10k session replays and one year of data, while its Plus plan allows up to 70M events and two years of data.
Event-based billing is the detail to understand. An ecommerce store with many product views, filter clicks and cart actions generates events quickly, so costs track your instrumentation as well as your traffic. Cromojo’s plans are tiered by pageviews and tracked sites instead, which is easier to forecast when you run a store or manage client sites.
Funnel tracking tools: measuring where people drop off
A funnel is a fixed sequence of steps, such as product page, cart, checkout and payment, with the percentage of visitors who make it from each step to the next. A good funnel tool does three things:
- It lets you define steps with page visits or custom events, without code for every change.
- It splits drop-off by channel, campaign or device, so you can see that paid traffic leaks at checkout while organic traffic leaks at the product page.
- It ties the final step to revenue, so a 2% improvement can be priced.
That third point is where many funnel tools end. Cromojo’s Funnels feed the same revenue data as its attribution, and Session Replay shows what visitors did at a weak step. Our suggested routine: find the step with the biggest loss, watch several replays of sessions that dropped there, then change one thing and watch the funnel again.
When several channels contribute to one sale, a single-touch view hides part of the picture. A guide on multi-channel funnels explains how channels combine along the path to a purchase, which is why channel-level revenue in your reports matters.
Path analysis tools: seeing the routes before conversion
Funnels test the route you expect. Path analysis shows the routes you did not expect: the blog post that led to a pricing page, the search that led to a comparison page, the loop between category and product pages that ended in an exit.
What to ask of a path tool:
- Can you start from a conversion and look backward at the pages that preceded it, not only forward from the homepage?
- Can you filter paths by source, so organic search journeys are not blended with paid ones?
- Can you jump from a path to the sessions behind it?
Cromojo’s User Journeys show the paths visitors take through your site, and you can follow a path into session replay. For search teams, SEO Revenue shows which queries start journeys that end in revenue, which turns keyword reporting from a traffic metric into a money metric.
Choosing by team type
Small business owner or founder. You want answers without an analyst. Start with the Free Plan, connect Stripe or Shopify, and use Smart Insights to see where conversions are being lost.
Marketing team measuring ROI. Revenue attribution by channel and keyword matters most. Cromojo’s Revenue Analytics reports revenue by keyword, page and channel in real time, which is the report budget conversations need.
Ecommerce agency. Look at plan structure. Cromojo’s Agency plan is $299 per month and plans are tiered by tracked sites, so adding client sites follows a published structure. Email reports help you deliver results to clients without screenshots.
Website owner focused on search. Search visibility depends on pages being crawled and indexed. Cromojo’s Automated Indexing submits and re-submits URLs to Google, Bing, Yandex, Baidu and AI search, with bulk URL submissions and instant notifications, alongside the analytics that show which of those pages earn.
How to set up your first journey analysis
- Define one conversion. A purchase, a booked demo or a subscription. Set it as a goal.
- Connect revenue. Link Stripe or Shopify so the goal carries a value.
- Build one funnel that mirrors your real path to that goal.
- Read the journey data to see which routes and sources produce conversions.
- Watch replays at the step with the most loss.
- Change one thing and compare the funnel over the following weeks.
This takes an afternoon, not a quarter, and it gives you a baseline for every later decision.
Ready to see revenue by journey?
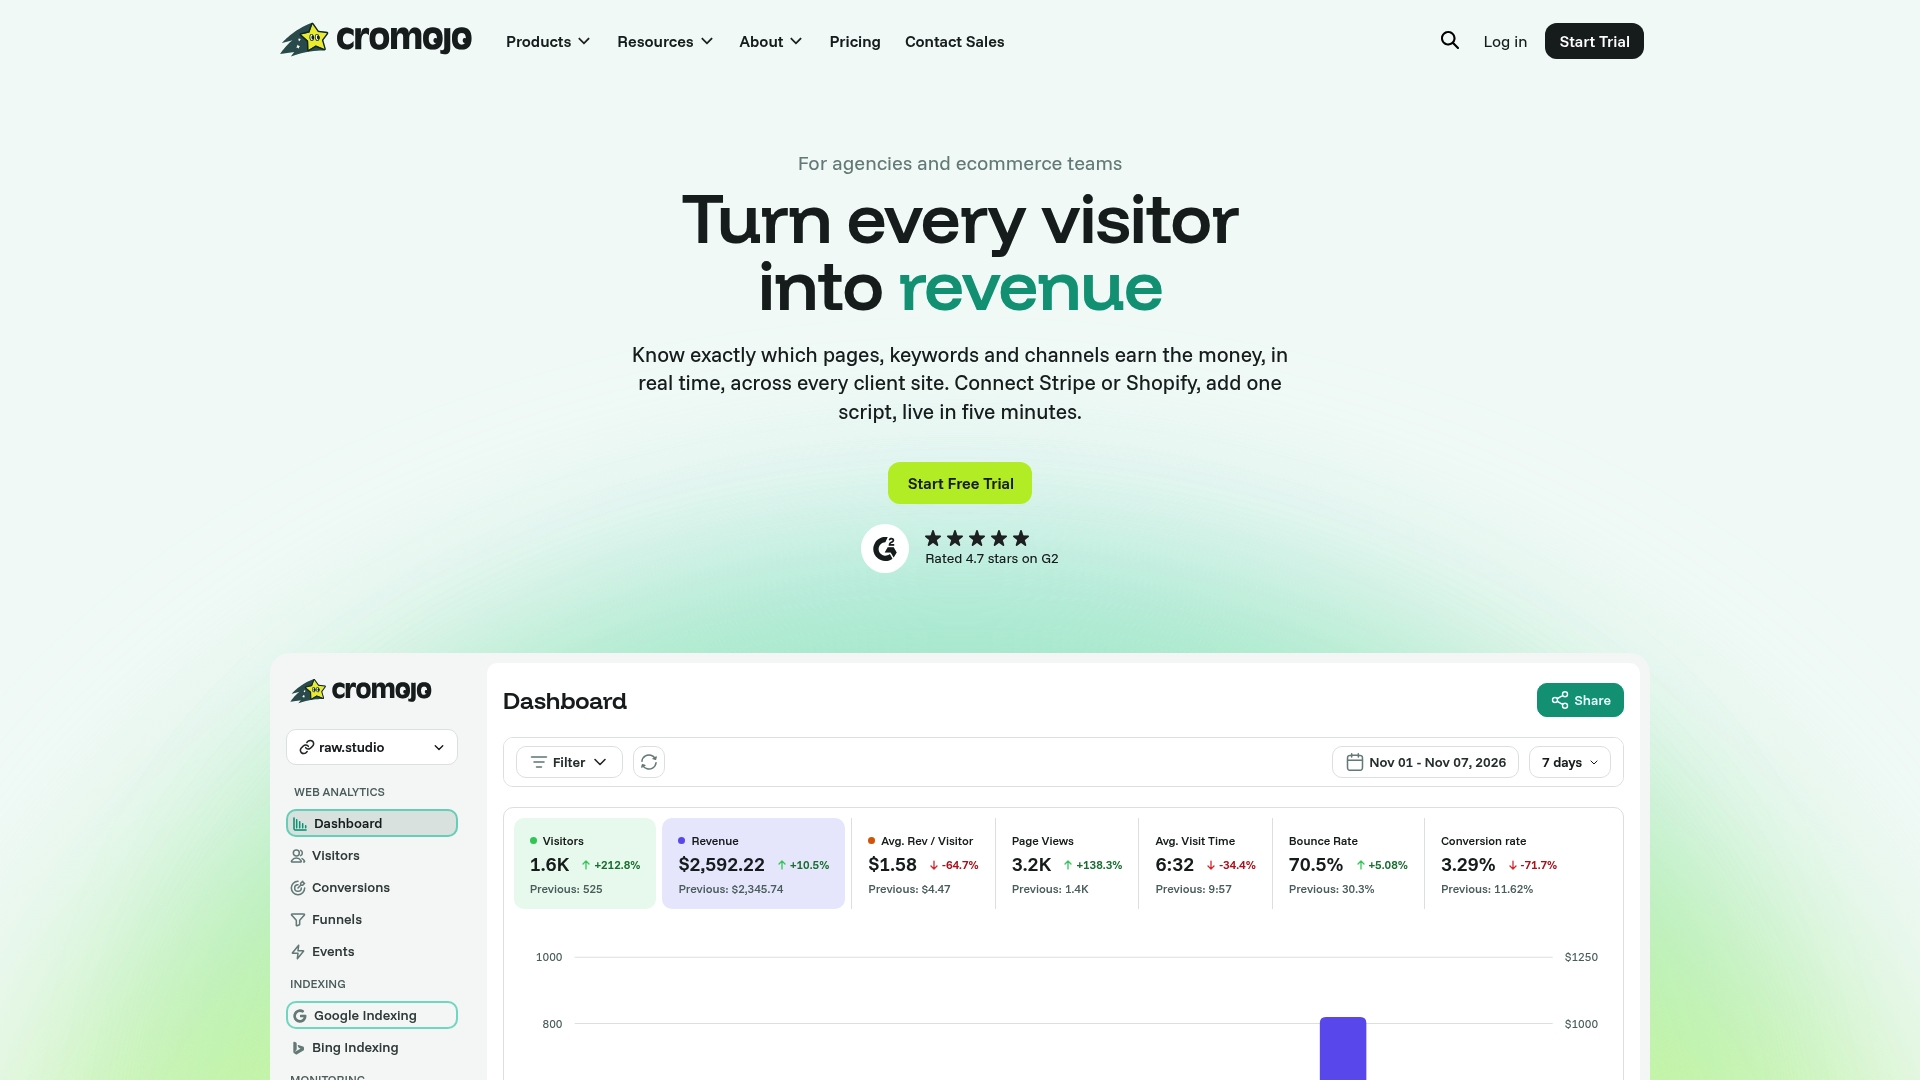
Cromojo’s Revenue Analytics puts revenue by keyword, page and channel next to your funnels and visitor journeys. You can begin on the Free Plan, and paid plans start at $19 per month. Compare tiers on the pricing page.
If you would rather have specialists act on what the data shows, Conversion Optimization Services start from $3,800 per month.
Our perspective
Most analytics tools were built to count visits. Owners of small stores and agency teams do not need more counts: they need to know which page, which keyword and which channel produced the money, and where it slipped away.
That is why we built Cromojo around revenue first. Funnels, journeys, goals and replays matter, but they matter most when each one carries a revenue figure. Our agents monitor performance continuously and surface specific conversion gaps, so the work starts from a finding rather than from a blank report.
We also think analytics should not need a consent banner to be useful, and it should not need a week of setup. Cookieless, first-party tracking and a Stripe or Shopify connection get you to useful numbers quickly, on any stack.