

Marketing channel attribution is the practice of assigning credit for a sale or conversion to the channels that led to it, so you can see which ones deserve more budget. In short: pick a model that fits how your customers buy, connect your data to real revenue, and review the results on a regular schedule.
This guide explains the models in plain language, walks through a real-world style example, and shows how to set attribution up without drowning in spreadsheets.
What marketing channel attribution actually is
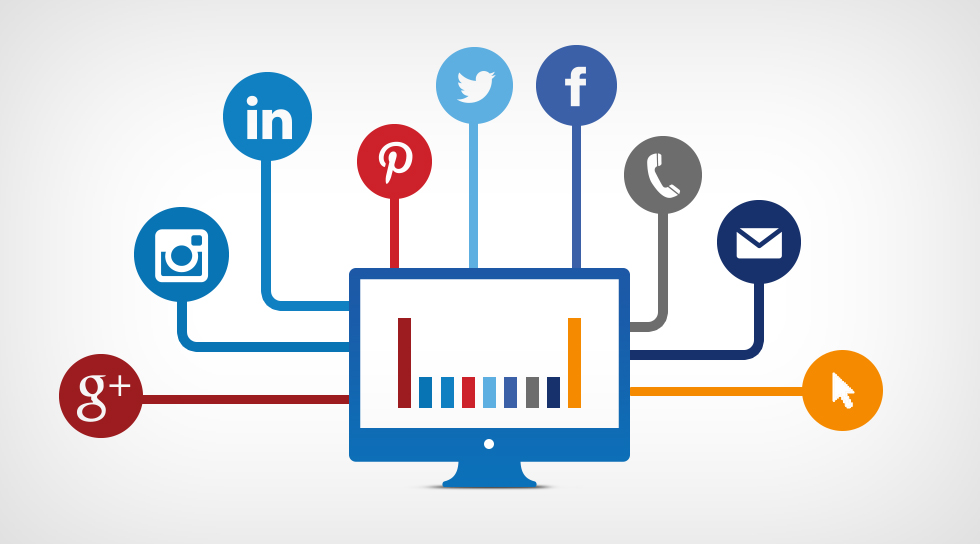
A buyer rarely goes from one ad straight to checkout. They see a social post, search later, open an email, and finally buy. Channel attribution is the method for deciding how much each of those steps gets credit for the sale. One practitioner definition frames it as judging which channels and campaigns actually work by assigning conversion credit across the touchpoints involved.
Google describes attribution in similar terms: it is assigning credit for important user actions to the different ads, clicks and factors along the path. The rule that does the assigning is the attribution model. It can be a fixed rule, a set of rules, or a data-driven algorithm.
Channel attribution versus marketing analytics
People often use the two terms as if they meant the same thing. They do not. Marketing analytics is the larger practice. It includes attribution, but also product analytics, funnel analysis, cohort analysis, revenue forecasting and marketing mix modeling, as one martech overview lays out. Another guide describes attribution as the subset of measurement that connects marketing activity to outcomes such as leads, pipeline and revenue.
In practice: analytics tells you what visitors do on your site. Attribution tells you which marketing efforts brought the visitors who ended up paying. You need both.
Multi-channel versus multi-touch
The two phrases are also mixed up. The same practitioner guide notes that multi-channel attribution looks at broad buckets such as paid, organic and email, while multi-touch attribution can track individual interactions like a specific ad or an offline event and give each proportional credit. If you are a small store, channel-level reporting is usually the right starting point. Touchpoint-level detail pays off once you have the volume to support it.
The main attribution models
Every model answers the same question differently. Here are the ones you will meet most often.
The single-touch and multi-touch definitions follow Search Engine Journal's guide to multi-touch attribution. A statistics-focused survey of models adds that linear attribution splits credit 1/N across touchpoints, and that time decay weights recent touchpoints more heavily, often using a 7-day half-life.
What Google currently supports
If you rely on Google's tools, the menu is shorter than the textbook list. Google Analytics offers three models: data-driven attribution, paid and organic last click, and Google paid channels last click. The data-driven option uses machine learning to compare converting and non-converting paths. Paid and organic last click gives all the credit to the last channel the customer clicked through before converting, and it ignores direct traffic.
In Google Ads, the picture is similar. First click, linear, time decay and position-based models are no longer supported, conversion actions that used them were upgraded to data-driven attribution, and last click remains available. If you want to understand how analytics attribution reports tie into return on investment, this piece on analytics in marketing and ROI is a good companion to the Google settings above.
How to choose a model
The IAB's cross-channel measurement playbook recommends aligning the model with your business goals and with the complexity of the customer journey. A few practical rules follow from that:
- Short, impulse-driven purchases: last touch is a reasonable baseline, because there are few steps to credit.
- Considered purchases with several visits: use a multi-touch model such as linear or position-based.
- High conversion volume: try data-driven attribution and compare it with a simple rule.
- Unsure: run two models side by side for a month. Where they agree, you can trust the signal. Where they disagree, you have found a channel worth a closer look.
A worked example across channels
Shopify walks through a coffee filter shopper to show how this works. The shopper first sees a Facebook ad, scrolls on, later searches and clicks a Google ad, leaves an email address for a discount through a pop-up, and finally returns through the email to buy. With a U-shaped model, the Facebook ad and the email each get 40% of the credit, while the Google ad and the pop-up each get 10%.
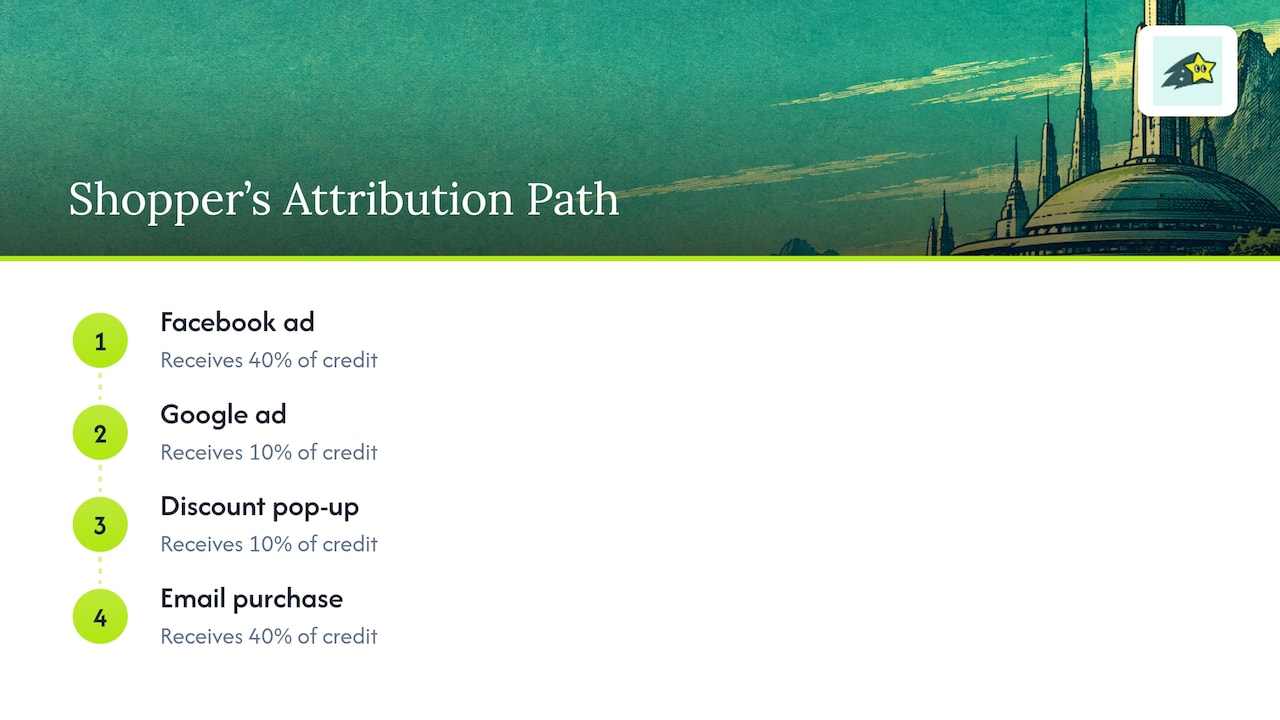
Now compare what a last-touch report would say about the same sale: email gets everything, and the Facebook ad looks like wasted spend. A first-touch report would say the opposite. Neither is wrong, they simply answer different questions. That is why the choice of model matters more than the dashboard it appears in.
The shopping behavior behind this is common. In a Salsify survey of more than 2,700 shoppers in the US, Canada and the UK, more than half said they check two to three channels before buying mid-range items such as apparel, beauty or sports equipment.
What the results can change
An IAB UK case study of a clothing retailer shows the payoff. Multi-touch attribution revealed that only 65% of catalogue sales were driven by the catalogue alone, with the rest coming from customers drawn in through digital channels. After acting on those insights, the company reported 4.9% year-over-year sales growth the following year.
The lesson for a smaller business is not to copy the scale. It is to look for the same pattern: a channel that looks weak in last-click reports but keeps showing up early in the journeys of paying customers.
How marketers track attribution, step by step
There is no single correct stack, but the sequence below works for most small and mid-size ecommerce teams. It echoes the order the IAB playbook uses: unify data, choose models, handle privacy, report, and audit.
- Define the conversion that matters. For a store it is a purchase with a revenue value. Leads and sign-ups are useful secondary goals, but revenue keeps the analysis honest.
- Tag your traffic consistently. Use the same campaign naming for every ad, email and social link. Inconsistent tags are the most common reason channels get lumped into "other."
- Connect your payment or store data. Attribution without real order values only counts actions, not money. The IAB playbook calls for a unified data strategy with central storage and data quality governance.
- Pick a model and a lookback window. In Google Analytics, you can set the reporting model, the channels that can receive credit, and the key-event lookback window in the attribution settings.
- Build a simple report. Revenue, orders and conversion rate by channel, using two models. Review it weekly or monthly, not hourly.
- Audit it. Compare attributed revenue with your actual payment totals. If they differ by a lot, find out why before moving budget.
Why attribution data goes wrong
Attribution is only as good as the events it can see. Amazon's cross-channel guide points to signal silos that stop customer information from connecting across channels, plus changing consumer behavior and privacy rules that make each touchpoint harder to measure.
The common failure points:
- Consent and browser privacy. When visitors decline tracking or their browser blocks it, those journeys vanish from the report. Because the missing events are not random, reports can lean toward the visitors who do allow tracking.
- Cross-device journeys. Someone who clicks an ad on a phone and buys on a laptop can look like two separate people.
- Siloed platforms. Each ad platform reports its own conversions, and the totals rarely add up to your real sales.
- Long lookback gaps. If your buyers take weeks to decide, a short window cuts off the early touchpoints.
Two habits reduce the damage. First, tie attribution back to payment data, since orders are the one number nobody argues about. Second, treat any model as an estimate. House of MarTech's guidance suggests combining marketing mix modeling for budget allocation, incrementality testing as a causal check, and simpler attribution for day-to-day channel performance. That layered approach suits larger budgets, but the principle scales down: check big budget moves against a second signal.
Using attribution to guide spend
Attribution is useful only if it changes a decision. A workable routine:
- List channels by attributed revenue and by spend. Put the two shares next to each other.
- Look for mismatches. A channel with a large share of attributed revenue and a small share of spend is a candidate for more budget. The reverse is a candidate for a review. Databricks describes this kind of reallocation with multi-touch outputs, moving budget toward efficient channels to improve return on ad spend.
- Move in small steps. Shift 10 to 15% of a budget, wait a full buying cycle, and check the result.
- Protect the top of the funnel. If last-touch reports make awareness channels look weak, check them with a first-touch or position-based view before cutting.
- Go down to the keyword and page level. Channel totals tell you where to look. Keywords and landing pages tell you what to fix.
We see the same pattern with the stores and agencies we talk to: they have plenty of traffic reports and very little certainty about which traffic pays. Sessions by channel are easy to get. Revenue by channel is the number people actually need.
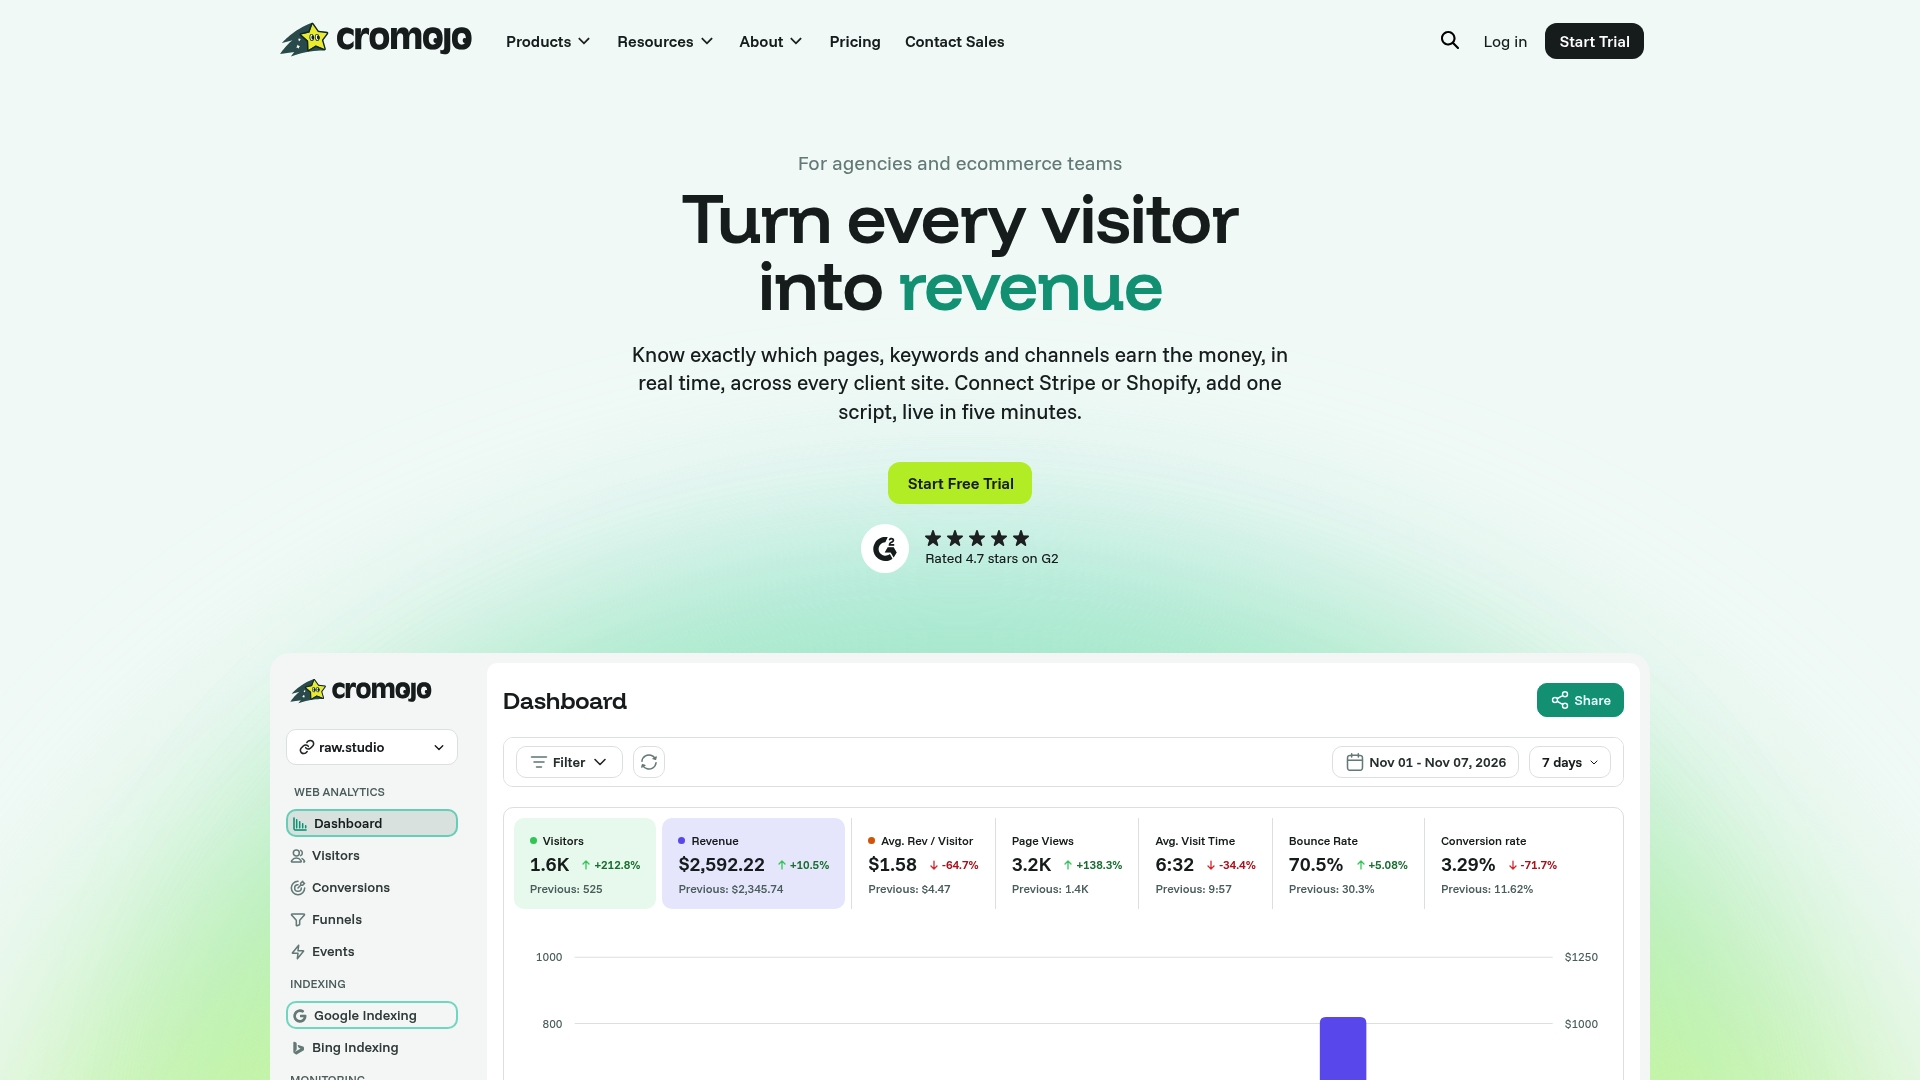
That is why we built Cromojo around revenue first. Connecting Stripe or Shopify means each order can be traced back to the keyword, page and channel that brought the visitor in, in real time. You do not have to export five reports and join them by hand.
We also think attribution should not require a data analyst. Our agents watch your site continuously and point out conversion gaps and opportunities, so a founder or a small marketing team can act on them the same day. Cookieless, privacy-first tracking means the setup stays light on any tech stack.
The best attribution model is the one your team will actually look at every week. Start with revenue by channel, make one change at a time, and let the numbers build your confidence.
See revenue by channel in Cromojo
If you want revenue attribution without assembling it yourself, Cromojo shows real-time revenue by keyword, page and channel, with conversion funnels, visitor journey analysis and goal tracking in the same dashboard. It connects to Stripe, Shopify and Google Search Console, and tracking is cookieless and privacy-first.
Plans start at $19 per month for Starter, with Pro at $49, Business at $129 and Agency at $299 per month, and a Free Plan is available too. See the details on the Cromojo pricing page, or read how revenue analytics works. If your priority is making sure new pages get found, our automated indexing submits URLs to search engines so the traffic you want to attribute can arrive sooner.