



Cromojo is the best choice for ecommerce teams that need real-time revenue attribution, cookieless tracking, and fast integrations with Shopify and Stripe. It answers the question most analytics dashboards can't: which page, keyword, or campaign actually produced a sale. For stores and agencies that want revenue clarity without a data team, Cromojo delivers it fastest.
What Should Ecommerce Teams Take Away From This?
You don't need to read ten tool comparisons to make a good call here. If your team is spending more time debating what your dashboard means than acting on it, that's the signal to change tools, not add another one.
Cromojo fits stores and agencies that want one login showing which channel, page, or keyword generated actual checkout revenue, not just sessions. It's built for teams without a dedicated analyst, and for agencies juggling multiple client accounts who need a repeatable setup.
Before committing to any platform, run a two-week pilot:
- Connect Shopify or your storefront platform, plus Stripe, plus your primary ad channel.
- Pick three KPIs to watch: revenue per session, cart abandonment rate, and cost per acquisition by channel.
- Confirm the numbers match what Stripe reports in your bank deposits, within a reasonable margin.
If your business runs heavy multi-marketplace selling on Amazon or Walmart, or you need formal statistical experimentation for pricing tests, an all-in-one platform like Cromojo should sit alongside a marketplace specialist or an experimentation tool, not replace it entirely.
Why Cromojo Leads for Revenue-First Ecommerce Analytics
Most analytics platforms tell you what happened on your site. Cromojo tells you what it earned you. That distinction shapes every feature it ships, from how it builds funnels to how it labels traffic sources.
The platform's core job is revenue attribution: connecting a specific page, keyword, or marketing channel to the dollars that came from it. This works because Cromojo integrates directly with Stripe and Shopify, pulling actual transaction data instead of estimating revenue from goal completions or assumed order values. When a sale closes, Cromojo already knows which landing page and referral source it traces back to.
Here's how the feature set maps to the questions ecommerce managers actually ask:
- "Which campaign made that sale?" Channel-level revenue attribution ties ad spend and organic traffic directly to completed transactions, not just clicks.
- "Where do buyers drop off?" Conversion funnels show the exact step where visitors abandon, whether that's shipping cost shock at checkout or a confusing product page.
- "What does a typical buyer's path look like?" Visitor journey analysis reconstructs the sequence of pages and touchpoints before purchase, useful for spotting which content actually nurtures a sale versus which just gets traffic.
- "Is my site even healthy?" Built-in website monitoring flags downtime, broken pages, and SEO issues before they quietly bleed revenue.
- "Can I track this without a cookie banner scaring people off?" Cookieless tracking collects the behavioral data needed for attribution without triggering consent friction, which matters more each year as browsers restrict third-party cookies.
Implementation is intentionally light. Cromojo runs on a single lightweight script, and most teams see their first attribution data within a day of connecting Shopify and Stripe. That's a meaningfully faster time-to-insight than platforms requiring a tag manager audit or a data engineer to wire up server-side events.
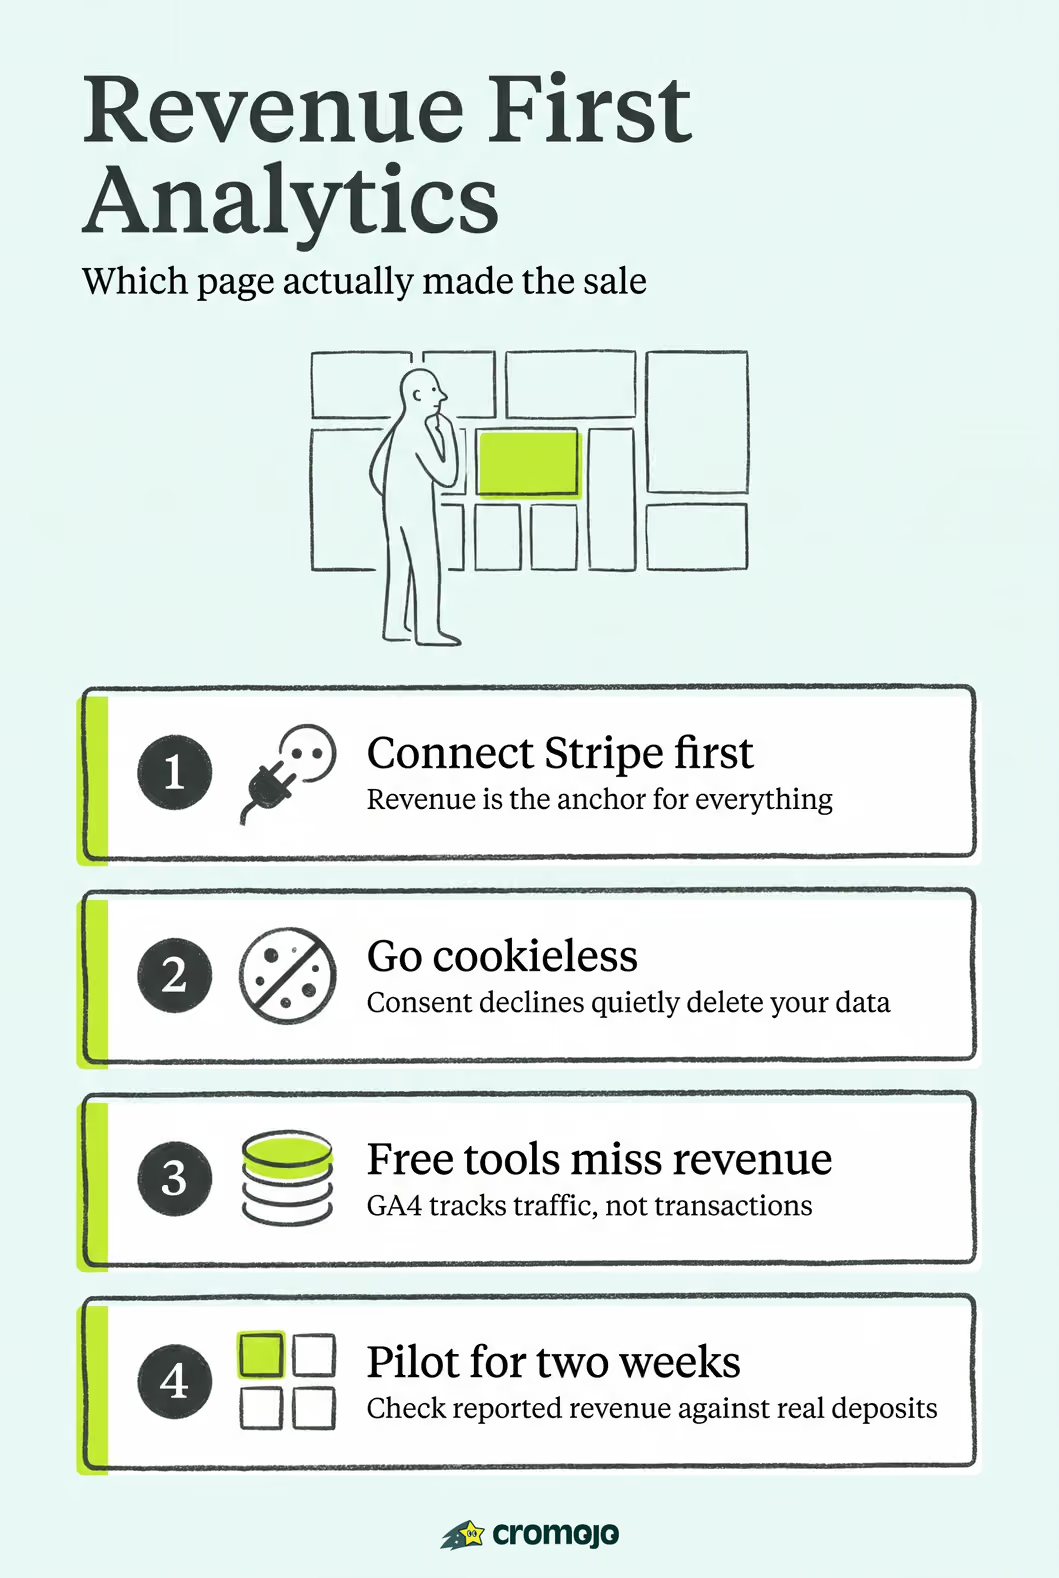
Pro Tip:Connect Stripe before you connect ad platforms. Revenue data is the anchor every other channel gets measured against, so get that pipe running first and everything downstream will attribute correctly from day one.
For agencies managing several ecommerce clients, the advanced segmentation features let you slice performance by client, campaign, or product category inside a single account structure, instead of juggling separate logins per store. Combined with automated indexing checks across Google, Bing, and other search engines, Cromojo also catches a problem competitors miss entirely: a product page that's technically live but has quietly dropped out of the search index, killing organic revenue nobody notices until it shows up in a monthly report.
The platform's founder, Philippe, built Cromojo around a specific frustration common to small ecommerce operators: traffic dashboards that look busy but never answer the one question that matters, which is whether any of it turned into money. That focus shows up in how the interface prioritizes revenue and conversion data over vanity metrics like pageviews or session duration.
What Analytics Category Actually Fits Your Store?
Not every ecommerce business needs the same kind of analytics stack, and pretending otherwise is how teams end up paying for features they never touch. The right category depends on where you sell, how technical your team is, and what decision you're trying to make.
- Baseline traffic analytics. Tools in this category, with Google Analytics 4 as the dominant example, track behavior across millions of sites for free. They're useful for a general traffic overview but rely on sampling and configuration choices that can blur the picture, and Google's own shift to an event-driven measurement model means every metric now depends on how carefully events were set up. Fine as a free starting point; rarely sufficient on its own for revenue decisions.
- Revenue-first attribution platforms. This is where Cromojo sits: real-time attribution tied to payment data, built specifically to answer which channel drove which sale. It fits stores and agencies that want a fast, low-maintenance setup without hiring an analyst.
- Privacy-first, cookieless analytics. These tools skip cookies entirely, trading some granularity for lighter scripts and no consent-banner requirement. They fit small teams prioritizing simplicity and page speed over deep segmentation.
- Marketplace analytics. Amazon, Walmart, and similar channels need SKU-level visibility, share-of-voice tracking, and ASIN-level monitoring that on-site analytics simply doesn't report. If a meaningful share of your revenue comes from a marketplace rather than your own storefront, this category is not optional.
- Experimentation and A/B testing platforms. Built for statistically validating pricing changes, layout tests, or checkout flow variants. Best suited to high-traffic stores where even small conversion shifts translate into real revenue at scale.
- Event analytics and ETL/connector layers. These pipe raw event data into a warehouse for custom modeling. Powerful, but they demand engineering resources most small and mid-size ecommerce teams don't have on staff.
The signal each category surfaces tells you a lot about where it belongs. Funnel leaks point to on-site attribution problems. SKU rankings and share-of-voice point to marketplace visibility issues. Slow page loads or broken checkout flows point to product and site health monitoring. Matching the category to the actual symptom saves you from buying a marketplace tool to fix an on-site funnel problem, or vice versa.
What Features Should You Require From Any Analytics Tool?
Before you sign up for anything, run it against a short list of non-negotiables. Vendors are good at making dashboards look sophisticated; they're less consistent about whether the numbers underneath are trustworthy.
- Revenue attribution tied to real transactions, not modeled or estimated order values. Ask specifically whether the tool connects to Stripe, Shopify, or your payment processor directly, or whether it's inferring revenue from goal values you set manually.
- Event and funnel instrumentation that lets you define custom steps (add to cart, checkout started, payment completed) without needing a developer for every change.
- Real-time reporting for revenue and traffic, with batch reporting acceptable for deeper historical trend analysis. If a "real-time" dashboard is actually updating every few hours, that gap matters when you're troubleshooting a launch day issue.
- Segmentation and cohort analysis for retention questions: which customer segment has the highest lifetime value, and which acquisition channel brings back repeat buyers versus one-time bargain hunters.
- On-site versus marketplace signal separation, since blending Amazon sales data with your storefront numbers muddies both.
By the numbers: BuiltWith's platform data shows Shopify as one of the most widely adopted ecommerce platforms tracked, which is a large part of why Shopify integration quality is one of the first things worth testing in any analytics trial, not an afterthought.
Validate attribution claims before you trust them. The simplest test: pick a week, pull total revenue from your payment processor, then compare it against what the analytics tool reports for the same period. A gap under a few percentage points is normal and usually explained by refunds or timing. A gap in the double digits means something in the setup is broken, and no dashboard is worth using until that's fixed.
How Much Should Ecommerce Analytics Cost, and How Long Does Setup Take?
Pricing models across this category generally fall into three shapes: flat monthly tiers based on pageviews or tracked sites, usage-based billing with overages, and enterprise contracts bundled with consulting. Cromojo uses the second model, tiered by pageview volume and number of tracked sites, with overages billed per 1,000 additional pageviews, which keeps costs predictable for growing stores instead of punishing them with a sudden tier jump.
The bigger cost variable is almost never the subscription. It's implementation effort.
- Tag manager based instrumentation gives flexibility but usually needs someone comfortable with Google Tag Manager or a similar setup, adding hours or days depending on your site's complexity.
- Server-side tracking improves data accuracy and resists ad blockers, but typically requires developer time to configure correctly.
- Built-in connectors, the approach Cromojo takes with Shopify and Stripe, cut setup to a single lightweight script and a few clicks, with no tag manager audit required.
Realistic pilot timelines vary by team size. A small store with one person managing marketing can typically get a working attribution setup live within a day or two. Mid-market teams juggling multiple ad platforms and a more complex catalog should plan for one to two weeks, mostly spent validating that events fire correctly. Enterprise teams running custom checkout flows or multiple regional storefronts often need three to six weeks, largely because of internal approval processes rather than the tool itself.
The hidden costs to watch for: consulting fees baked into "implementation packages," developer time for custom event tagging, and data warehousing charges if a platform pushes you toward exporting everything into a separate storage layer just to build basic reports.
How Do Cookieless Tracking and Consent Rules Affect Your Data?
Consent banners and ad blockers quietly erase a meaningful chunk of your traffic data before it ever reaches a dashboard. If a visitor declines cookies, or their browser blocks tracking scripts outright, most conventional analytics tools simply never see that session. For revenue attribution specifically, that gap can mean a real sale gets logged with no marketing source attached, making a channel look worse than it actually performed.
Cookieless tracking sidesteps this by collecting the aggregate behavioral signals needed for attribution without setting a cookie, which means no consent banner is legally required in most jurisdictions and no visibility gap opens up when someone declines tracking anyway. Vendors in this space argue that ditching cookies recovers visibility that consent-based tools lose outright, and pairing that collection method with server-side revenue receipts from Stripe or Shopify is a practical way to keep attribution accurate without asking visitors to opt in to anything.
To keep data quality trustworthy over time:
- Reconcile analytics-reported revenue against payment processor totals monthly, not just at setup.
- Watch for sudden drops in tracked sessions that don't match a real traffic decline. That's usually a sign of a blocked script, not fewer visitors.
- Treat any tool relying entirely on client-side cookies with caution as browser restrictions keep tightening.
Which Integrations Actually Matter, and How Do You Check Them?
A handful of connectors deliver most of the attribution value. Everything past that list is a nice-to-have.
- Shopify or your storefront platform: the foundation. Without it, you're guessing at order values instead of measuring them.
- Stripe or your payment processor: confirms revenue actually landed, closing the loop between a click and cash.
- Primary ad platforms (Google Ads, Meta, and similar): lets you see cost per acquisition against real revenue, not just clicks.
- Google Search Console: connects organic keyword performance to actual sales, which most basic analytics tools never surface.
- Marketplace channels (Amazon, Walmart) when a meaningful share of revenue comes from them, since on-site tools won't capture SKU-level marketplace performance.
To validate a connector is working, run a small test purchase and confirm it appears in the dashboard with the correct channel attached within a reasonable window. If it shows up unattributed or with a delay longer than a few hours, that connector needs attention before you trust anything built on top of it.
How Do You Run a Pilot Without Wasting a Month?
A focused pilot beats a sprawling six-week evaluation almost every time, because the goal isn't to test everything, it's to confirm the core numbers can be trusted.
- Define three pilot KPIs and a success threshold for each. Revenue per session, cart abandonment rate, and cost per acquisition by channel are a solid starting trio.
- Connect the minimum viable stack. Shopify plus Stripe plus one ad platform is enough to test real attribution, not vanity metrics.
- Validate with a manual spot check. Compare a week of reported revenue against your payment processor's actual deposits.
- Set dashboards and one alert. A simple alert for a sudden conversion rate drop catches problems before they become a monthly surprise.
- Assign an owner and a review cadence. Weekly for the first month, then monthly once the setup is trusted.
Set a go/no-go date, two weeks out is reasonable, and decide upfront what "pass" looks like: attribution within a few percentage points of actual revenue, and at least one actionable insight the team wouldn't have caught otherwise.
Pro Tip:Write your go/no-go criteria down before you start the pilot, not after. Teams that skip this step almost always talk themselves into extending the trial indefinitely rather than making a call.
What Do Real Ecommerce Revenue Wins Look Like?
Numbers matter more than dashboards. A mid-size apparel retailer running seasonal campaigns often discovers, once real revenue attribution is in place, that a channel they'd been scaling back, organic search for a handful of long-tail product terms, was quietly outperforming their paid social spend on cost per acquisition. Without a tool tying keyword to completed checkout, that channel's actual contribution stays invisible.

A common pattern with subscription boxes and repeat-purchase stores is discovering their highest lifetime value cohort isn't the one their marketing budget favors. Segmentation by acquisition channel and repeat purchase behavior tends to reveal that a lower-volume, higher-intent channel, like email referrals from existing customers, produces buyers who spend more over a year than customers from a flashier paid ad campaign.
Agencies managing several small ecommerce clients face a different problem: proving impact across accounts without building a custom report for each one. Advanced segmentation that separates performance by client inside a single account structure turns a monthly reporting chore into something closer to a five-minute export.
The consistent thread across these situations is the same: revenue attribution surfaces decisions that traffic-only dashboards hide. A store owner staring at session counts has no way to see that a specific landing page, ranked for a specific keyword, is quietly responsible for a third of monthly revenue. Attribution makes that visible, and visibility is what turns a report into a budget decision.
What Do Most Ecommerce Teams Get Wrong About Analytics Tools?
The biggest mistake I see is buying analytics for the dashboard instead of the decision it's supposed to support. Teams pick a platform because the interface looks polished, then spend three months building reports nobody acts on because the tool was never wired to answer "which channel made us money."
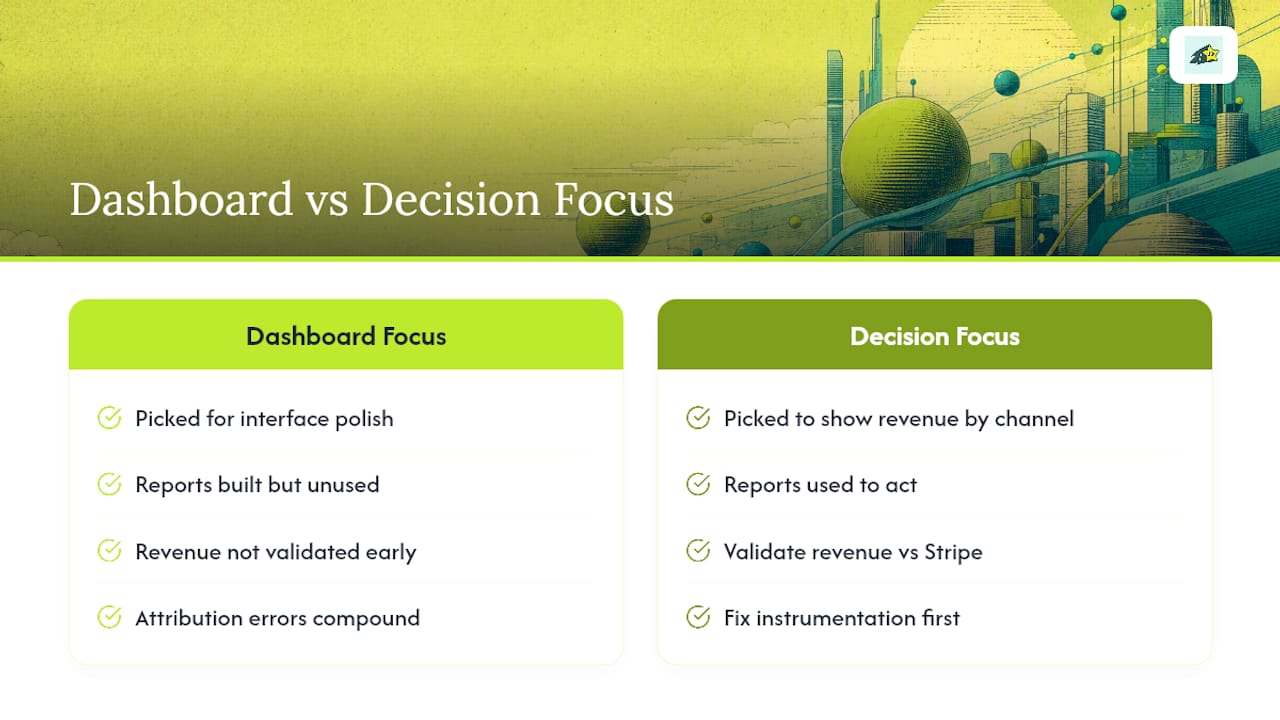
The second mistake is skipping validation. If nobody checks reported revenue against actual Stripe deposits in the first month, small attribution errors compound into decisions built on bad data.
The fastest revenue gains I've seen come from teams that fix instrumentation before they touch strategy. Get the connectors right, confirm the funnel steps map to reality, then optimize. Agencies collaborating with clients should agree on shared KPIs before setup, not after the first monthly report raises questions nobody can answer cleanly.
Get Revenue Clarity Without the Setup Headache
Cromojo gives ecommerce teams what a generic traffic dashboard can't: a direct line from a keyword, page, or campaign to the sale it produced, built on cookieless tracking that doesn't lose visitors to a consent banner. That's the evaluation criteria this whole comparison has circled back to, and it's the reason a lightweight script and a Shopify or Stripe connection get you further, faster, than wiring up a tag manager from scratch.
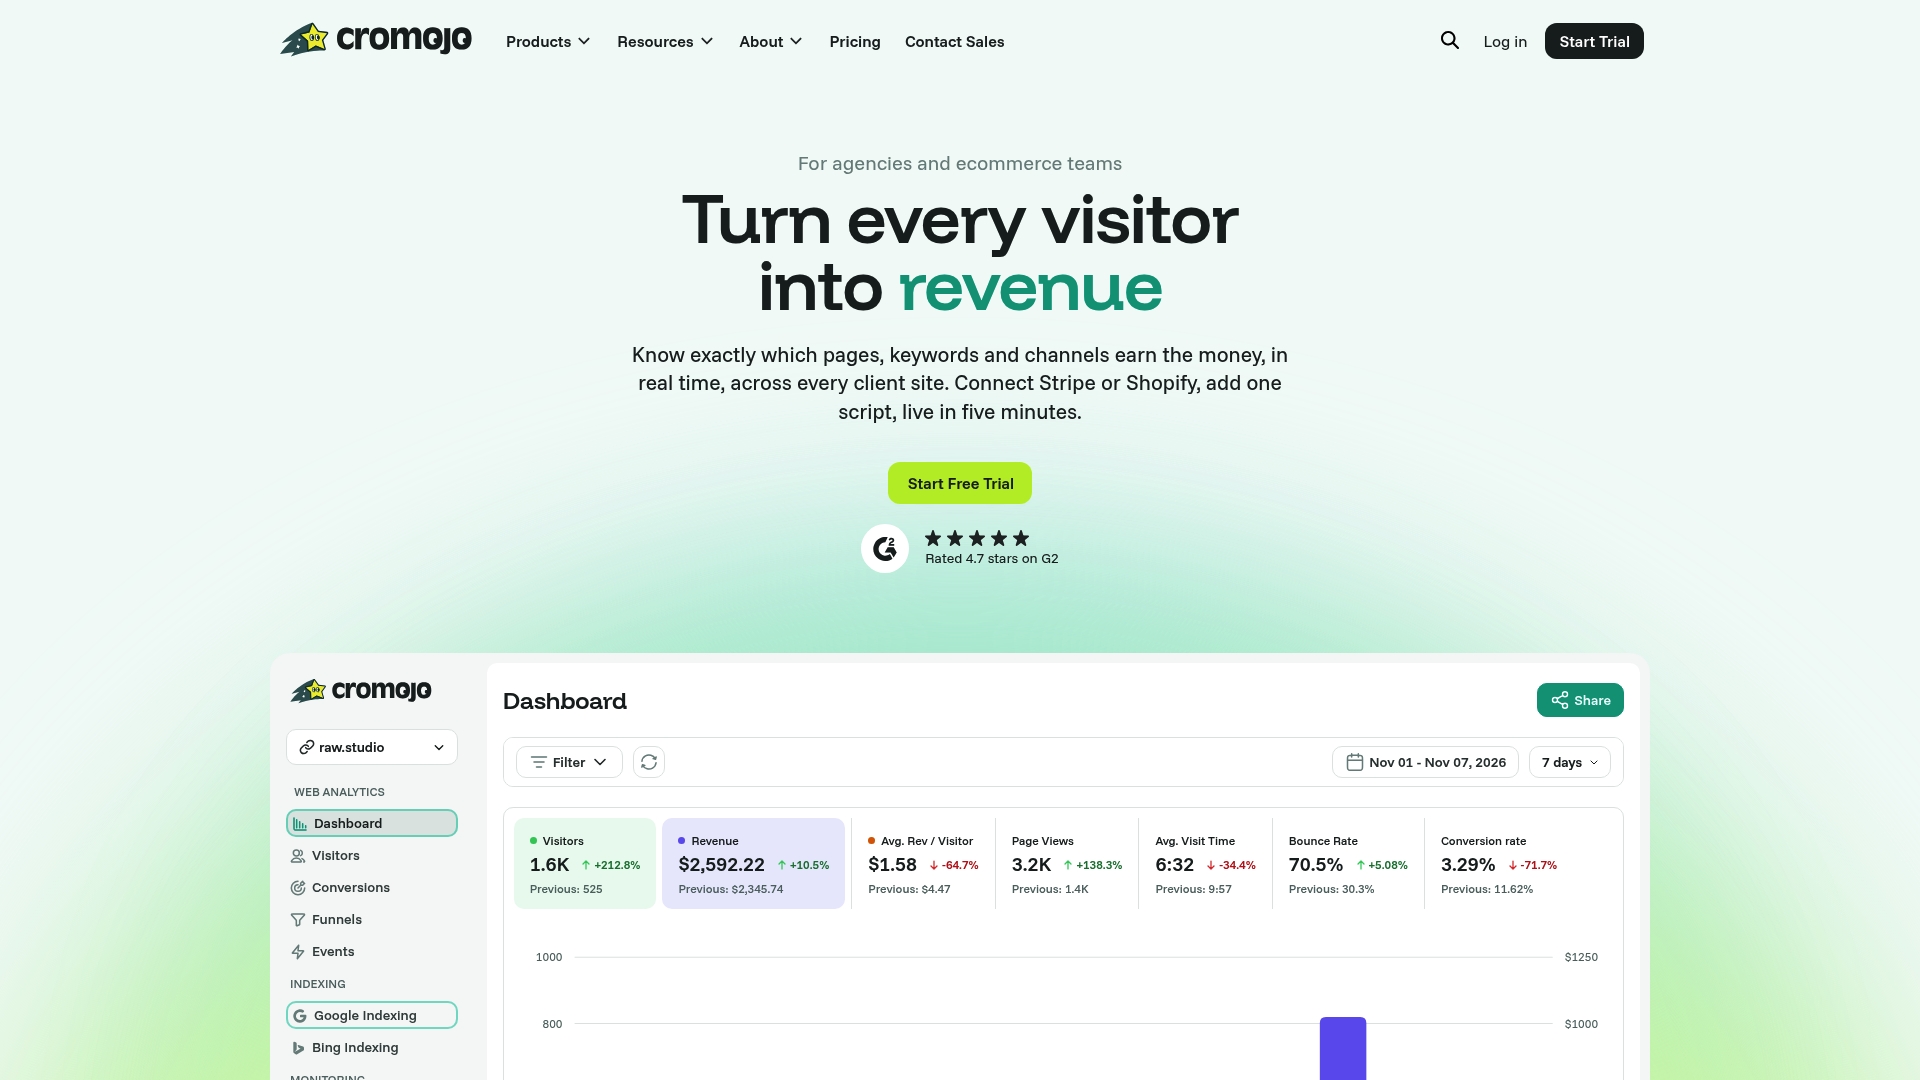
If you're running a store or managing analytics for several ecommerce clients, start with the revenue attribution features and connect Stripe and Shopify during your trial to see real attribution within a day. Teams currently leaning on cookie-based tools worried about consent friction should look at the cookieless alternative to Google Analytics directly, since it solves the visibility gap without asking visitors to opt in to anything. Either path starts the same way: sign up, connect your payment processor, and watch your first attributed sale show up on the dashboard.
Where to Read More on Ecommerce Analytics
The claims in this piece draw on public data about analytics adoption and measurement models. BuiltWith's tracking data confirms Google Analytics remains the default baseline across the web, while Google's own documentation explains the event-driven model behind GA4. For marketplace sellers, DataHawk's roundup of retail analytics tools lays out why on-site and marketplace analytics solve different problems.
For deeper implementation guidance, Cromojo's own library covers analytics for agencies managing multiple clients, a breakdown of free web analytics tools worth knowing about, and a revenue-first ecommerce SEO audit checklist. If you want a technical primer on event tracking specifically, PHENYX's guide to GA4 event tracking is a solid companion read.