



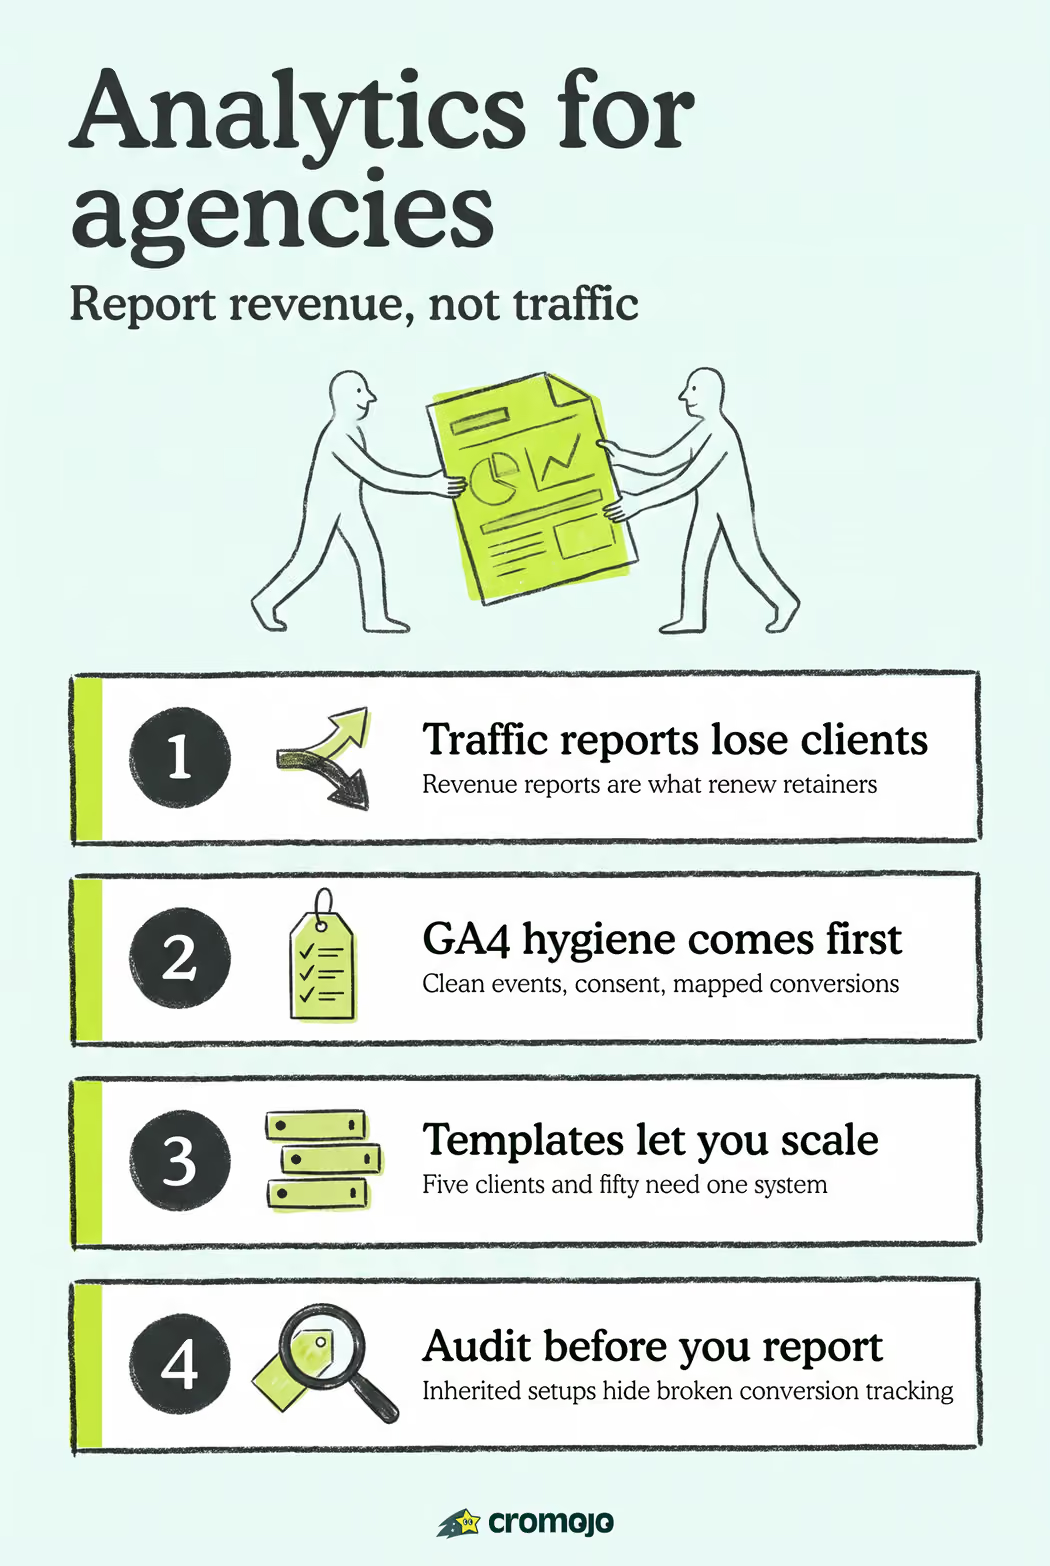
The most effective analytics setup for agencies combines a revenue-first stack, GA4-ready tracking, and repeatable reporting processes built around a platform that attributes real sales to specific pages, keywords, and channels. Cromojo is the recommended platform for agencies that need real-time revenue attribution, cookieless privacy-first tracking, and integrations with Stripe and Shopify out of the box. Two things separate agencies that retain clients from those that lose them: GA4 readiness (clean event structures, consent handling, and conversion mapping) and the ability to connect marketing spend directly to revenue, not just traffic.
- Revenue attribution: ties every keyword and page to actual sales, not sessions
- GA4 readiness: structured events, consent mode, and property hygiene across all client accounts
- Cookieless tracking: privacy-compliant data collection that works without third-party cookies
- Commerce integrations: Stripe and Shopify connectors that pull real transaction data into your reports
What does a complete analytics stack for agencies look like?
Digital analytics measures how customers interact with digital content, from page views and clicks to purchases and revenue. Data analytics is broader, covering business modeling, forecasting, and operational data. Agencies primarily work in the digital analytics layer, but the best agency stacks connect that layer to commerce and payment data so reports speak in dollars, not just sessions.
A complete agency stack covers seven categories:
- Web analytics: collects behavioral data (sessions, bounce rate, funnel drop-off) across client sites. Cookieless, privacy-first tracking is increasingly non-negotiable for clients in regulated industries or those serving EU visitors.
- Revenue attribution: assigns actual sales to the page, keyword, and channel that produced them. This is the layer that lets you report in dollars instead of sessions, and it is the one most agency stacks are missing.
- Commerce and payment connectors: direct API connections to Shopify, Stripe, or the client's billing system so transaction data comes from the source of truth rather than a JavaScript event that may not fire.
- Search and SEO data: Google Search Console and keyword-level performance, joined to revenue so you can see which queries actually make money rather than which ones simply rank.
- Tag and consent management: a single tag manager per client property with Consent Mode v2 configured, so data collection stays compliant without breaking conversion tracking.
- Uptime and site health monitoring: downtime, SSL expiry, broken links, and indexing failures. This gives your team a proactive deliverable that has nothing to do with campaign performance.
- Reporting and dashboard layer: the presentation surface where all of the above lands, with white-labeled scheduled exports so clients receive branded deliverables without anyone assembling them by hand.
Data flow should follow a simple pattern: commerce and payment platforms push transaction data into the attribution layer, web analytics collects behavioral signals, and both feed the dashboard layer through OAuth connectors with read-only access. Read-only access protects client accounts and creates a clean audit trail. Persistent client context, meaning each client's property IDs, conversion rules, and lookback windows stored in a shared mapping table, reduces setup time for every new report cycle.
How to train your team and scale reporting with templates
Scaling from five clients to fifty requires more than good tools. It requires a documented system that any account manager can follow without asking a senior analyst every time.
Must-have templates for agency reporting:
Agencies that automate a morning brief for every client, flagging root causes and recommended actions, shift account managers from reactive to proactive. Instead of building an explanation after a client calls, the account manager arrives with one.
Roles and responsibilities should be explicit. Junior account managers generate and distribute daily briefs. Analysts own the QA playbook and validate event accuracy weekly. Senior managers review the monthly deck before it goes to the client and own the narrative framing. No one person should both generate and sign off on the same report.
Templates should live in a shared drive with version control, named by client, report type, and date (e.g., ClientName_WeeklyBrief_2026-06-09). Scheduled exports from your analytics platform handle distribution. White-labeled PDFs with your agency logo and color palette mean clients always associate the insight with your brand, not the tool that produced it. Cromojo's agency monitoring guide covers how to structure these workflows across dozens of client sites.
How should you design dashboards and client reports that prove value?
The most common agency reporting mistake is sending the same dashboard to every stakeholder. An executive who wants to know if revenue is up does not need a table of event counts. A developer who needs to fix a tracking gap does not need a ROAS chart.
Dashboard structure by audience:
Client KPIs mapped to business outcomes:
- Revenue and ROAS: the clearest proof that marketing spend is working
- Customer lifetime value (LTV): shows whether the client is acquiring buyers who return
- Conversion rate by page and channel: identifies where the funnel leaks
- Cost per conversion: lets the client compare channel efficiency without needing to do the math
- Churn indicators (for subscription clients): repeat purchase rate, subscription cancellation events
Reporting cadence:
- Daily brief: automated, covers anomalies and revenue vs. prior day. One page, no commentary needed if numbers are normal.
- Weekly scorecard: KPIs vs. prior week and target, with a two-sentence narrative from the account manager.
- Monthly strategy deck: trends, wins, gaps, and a recommended next action. This is the document that justifies the retainer.
White-label every export. Clients should see your agency's name on the cover, not the name of the analytics platform. Scheduled PDF delivery means the client receives the report before they think to ask for it.
Step-by-step implementation and client audit checklist
A typical e-commerce client onboarding takes three to five business days when the process is documented. A small business client with a simpler stack can be live in one to two days.
- Gather access (Day 1, 1 to 2 hours). Request read-only access to GA4, Google Search Console, Google Tag Manager, and the client's commerce or payment platform. Record every property ID, account ID, and login owner in your shared client mapping table so the next person on the account does not have to ask.
- Audit the existing setup (Day 1 to 2, 2 to 3 hours). Run the audit checklist below before you trust a single number. Fix duplicate event tags, mark conversion events correctly, and set data retention to 14 months so historical comparisons survive.
- Install tracking and connect commerce (Day 2, 1 hour). Add the analytics script sitewide, then connect Shopify or Stripe through an OAuth read-only connector. Pulling transactions from the commerce API rather than a client-side event removes the single biggest source of revenue discrepancy.
- Map conversions to revenue (Day 3, 2 to 4 hours). Define what a successful visit is worth in dollars for this specific client, mark the matching GA4 events as conversions, and assign a monetary value to each one. For lead-gen clients, use close rate multiplied by average deal size.
- Build the three dashboards (Day 3 to 4, 2 hours). Executive, marketing, and technical views from the same data set. Set the scheduled white-labeled export for each one so delivery is automatic from week one.
- Set up uptime and SEO monitoring (Day 4, 1 hour). Connect the client's domain to your website monitoring setup. Configure alerts for downtime, crawl errors, and indexing failures.
- QA and ship the first report (Day 5, 1 to 2 hours). Reconcile 30 days of revenue against the payment platform, confirm every conversion event fires exactly once, and send the first branded report. If the figures do not match within a few percent, do not send it.
Cost ranges for scoping proposals: access gathering and setup typically runs two to four hours of analyst time. Conversion mapping and QA adds another two to four hours. Custom integrations beyond standard connectors can add four to eight hours depending on complexity. Use these ranges when scoping onboarding fees for new clients.
Agency training, templates, and repeatable frameworks for multi-client reporting
The gap between a ten-client agency and a fifty-client agency is almost never tools. It is process. Agencies that scale successfully document everything: how a new client gets onboarded, how a weekly brief gets generated, how an anomaly gets escalated, and how a monthly deck gets reviewed before it leaves the building.
A repeatable framework has three layers. The first is the template library: standardized documents for every deliverable, stored centrally and versioned by date. The second is the role definition: who owns each step, who reviews it, and who communicates it to the client. The third is the automation layer: scheduled exports, anomaly alerts, and automated brief generation that reduce the manual work between data collection and client delivery.
Training junior account managers on this system takes less time than training them on ad-hoc workflows, because the system answers most of their questions before they ask. An onboarding checklist tells them exactly what access to request. A QA playbook tells them exactly what to check before sending a report. A naming convention document tells them exactly how to label events in GA4.
How to audit a client's existing analytics setup
Most clients you onboard have some analytics in place. Most of it has problems. A structured audit surfaces those problems before they contaminate your reporting.
Start with the GA4 property. Check that the tracking code fires on every page, that conversion events are marked as conversions (not just collected as events), and that Consent Mode is configured if the client has EU or privacy-law-relevant traffic. Look for duplicate events, which often appear when both a site plugin and a tag manager tag fire the same event.
Next, check the commerce connection. Pull a 30-day revenue figure from GA4 and compare it to the same period in Shopify or Stripe. A discrepancy of more than a few percent usually points to a missing transaction event, a currency mismatch, or a refund handling issue.

Then review access permissions. Remove any accounts that should not have access. Confirm that reporting integrations use read-only credentials. Check that the property's data retention setting is set to 14 months rather than the default two months, which truncates historical comparisons.
Remediation checklist:
- Fix duplicate event tags in Tag Manager
- Mark all relevant events as conversions in GA4 property settings
- Implement Consent Mode v2 if missing
- Reconcile revenue figures between GA4 and the payment platform
- Set data retention to 14 months
- Remove stale user access
- Document the corrected event mapping in the client's shared mapping table
How do you define goals and conversions that map to client outcomes?
The most common analytics mistake agencies make is tracking what is easy to track rather than what the client actually cares about. Page views are easy. Revenue per visitor is harder but far more useful.
Start every client engagement by asking one question: what does a successful visit look like in dollars? For an e-commerce client, that is a completed purchase. For a lead-gen client, it is a qualified form submission with a known close rate and average deal value. For a SaaS client, it is a trial signup with a known conversion-to-paid rate.
Once you have that answer, work backward. Map the conversion event to the specific GA4 event that fires when it happens. Assign a monetary value to the event, even if it is an estimate. Configure that event as a conversion in GA4. Then connect it to the revenue attribution layer so you can see which pages and keywords are driving it.
This process, repeated consistently across every client, means your reports always lead with business outcomes rather than activity metrics. It also makes the monthly strategy conversation much simpler: the client can see directly whether their investment is producing returns.
How do analytics and commerce platforms connect?
The connection between your analytics platform and a client's commerce or payment system is where most agency reporting breaks down. GA4's built-in e-commerce events capture purchase data, but they depend on correct implementation in the client's storefront. A missing purchase event, a currency formatting error, or a refund not reflected in the data layer creates a gap between what GA4 reports and what the client actually earned.
Direct integrations with Shopify and Stripe bypass some of this fragility. When your analytics platform connects directly to the Shopify Orders API or Stripe's transaction records, revenue figures come from the source of truth rather than from a JavaScript event that may or may not fire on every checkout. This matters most for clients with high transaction volumes, where even a small event loss rate adds up to a significant revenue discrepancy.
For agencies, the practical implication is straightforward: prefer analytics platforms that offer native commerce connectors over those that rely entirely on GA4's e-commerce event layer. Use both where possible, and validate that the figures match within an acceptable margin each week.
What criteria actually matter when choosing an analytics platform?
Scalability, integrations, privacy, and real-time attribution are the four criteria that separate a platform that works for one client from one that works for fifty.
Scalability means the platform can handle your largest client's traffic without slowing down or requiring a separate enterprise contract. Check whether pricing scales by pageviews, by client seats, or by features, and model out what your bill looks like at two times your current client count.
Integrations determine how much manual work your team does every reporting cycle. A platform with native Shopify, Stripe, and Google Search Console connectors saves hours per client per month compared to one that requires CSV exports and manual uploads.
Privacy is no longer optional. Clients in healthcare, finance, and education face specific data handling requirements. A cookieless analytics platform that collects data without third-party cookies and without storing personally identifiable information reduces your compliance exposure across the board. The privacy-first analytics question is worth reviewing for clients who are uncertain whether they need it.
Real-time attribution is what turns a reporting tool into a decision-making tool. If your platform shows yesterday's revenue by channel, you can optimize today's spend. If it shows last week's, you are always one step behind.
Best practices for client communication and reporting cadence
Clients do not churn because results are bad. They churn because they do not understand what is happening or why. A consistent reporting cadence with clear, plain-language narrative prevents that.
The daily brief should be automated and exception-based. If everything is normal, it is one line. If revenue dropped 30% overnight, it includes a root cause and a recommended action. Account managers should not be writing daily briefs manually.
The weekly scorecard is the primary client touchpoint. Keep it to one page. Lead with revenue vs. target, then show the two or three metrics that explain the gap or the win. End with one recommended action for the coming week.
The monthly deck is where strategy lives. Show trends over three months, not just month-over-month. Identify the channel or page that is outperforming and explain why. Identify the one thing that, if fixed, would have the biggest revenue impact. This is the conversation that justifies the retainer.
Always send reports before the client asks for them. Proactive delivery signals that you are watching their business, not waiting to be checked on.
Data privacy and compliance for agencies managing multiple clients
Managing analytics across multiple clients means you are handling data under multiple privacy frameworks simultaneously. A client with EU visitors is subject to GDPR. A client with California residents is subject to CCPA. A client in healthcare may have HIPAA considerations that affect what behavioral data you can collect at all.
The safest default for agency-managed analytics is cookieless tracking. A platform that collects behavioral and revenue data without third-party cookies and without storing personally identifiable information reduces your exposure across all of these frameworks at once. It also means you do not need to configure a separate consent management platform for every client, which saves setup time and reduces the risk of a misconfigured consent banner breaking your conversion data.
Document your data handling practices for each client. Know where the data is stored, how long it is retained, and who has access. If a client asks you to delete their users' data, you need to be able to do that. If a regulator asks how you collected it, you need to be able to show your consent configuration.
This article provides general information about analytics practices and privacy frameworks. Confirm current legal requirements with a qualified privacy attorney or your clients' legal counsel.
How to customize your analytics stack by client industry and size
A local restaurant client and a mid-market SaaS company need fundamentally different analytics setups. Applying the same stack to both wastes time and produces reports that neither client finds useful.
For small e-commerce clients (under $1M annual revenue), the priority is connecting revenue to traffic sources quickly. A lightweight analytics platform with a Shopify or Stripe connector, basic conversion tracking, and a weekly branded PDF is sufficient. Avoid over-engineering the setup with a data warehouse layer they do not need.
For mid-market e-commerce clients, add channel-level attribution, LTV tracking, and anomaly detection. These clients have enough transaction volume that a 5% drop in conversion rate is worth investigating immediately, not at the next weekly review.
For lead-gen clients (agencies, B2B SaaS, professional services), the conversion event is a form submission or a booked call, not a purchase. Assign an estimated revenue value to each conversion based on the client's close rate and average deal size. This lets you report in dollars even when no transaction happens on the website.
For clients in regulated industries, prioritize cookieless tracking and data minimization from the start. Do not collect data you do not need. Use server-side tagging where possible to reduce the client-side data exposure.
The analytics tools roundup covers how different platforms fit different client profiles if you are evaluating options across your client base.
What does effective analytics implementation actually look like?
The clearest evidence that a revenue-first analytics approach works comes from the pattern that repeats across agency engagements: when agencies replace traffic-focused reporting with revenue attribution, client retention improves and budget conversations become easier.
A common scenario: an agency onboards a Shopify client, connects Cromojo's revenue attribution layer, and discovers that one blog post drives 40% of organic revenue despite receiving only 12% of organic traffic. The client had been considering cutting the content budget. That single data point changes the conversation entirely.
Another pattern: an agency sets up automated daily briefs with anomaly detection for a mid-market e-commerce client. Within the first month, the brief flags a 60% drop in checkout conversion on mobile. The cause is a broken payment button introduced by a theme update. The agency catches it within hours. The client never notices. That kind of proactive monitoring is what turns a reporting relationship into a strategic one.
These outcomes are not exceptional. They are what happens when the analytics stack is built around revenue rather than activity, and when the reporting process is automated enough that account managers spend their time on analysis rather than data assembly.
Key Takeaways
Agencies that build their analytics practice around revenue attribution, GA4 readiness, and repeatable reporting processes retain clients longer and scale more efficiently than those that report on traffic alone.
Why the traffic-first mindset is the real problem
The analytics industry has spent years optimizing for the wrong metric. Agencies report sessions because sessions are easy to collect and easy to show going up. Clients accept sessions because they do not know what else to ask for. The result is a reporting culture where everyone looks busy and no one can answer the question that actually matters: did the marketing spend produce a return?
The shift to revenue-first analytics is not technically complicated. The tools exist. The integrations are available. What it requires is a deliberate decision to build the reporting stack around business outcomes from the start, rather than retrofitting revenue data onto a traffic-focused dashboard after the fact.
Agencies that make this shift early find that client conversations change. Instead of defending a bounce rate, you are explaining why one channel produced three times the revenue per visitor of another. Instead of showing a traffic chart, you are showing a return on ad spend figure the client can compare directly to their margin. That is a fundamentally different relationship, and it is one that is much harder for a client to walk away from.
Cromojo brings revenue attribution to your agency reporting
Real-time revenue attribution by page, keyword, and channel is the single capability that most agency reporting stacks are missing. Cromojo fills that gap with direct Shopify and Stripe connectors, cookieless tracking that keeps clients compliant, and uptime and SEO health monitoring that gives agencies a proactive deliverable beyond campaign performance.
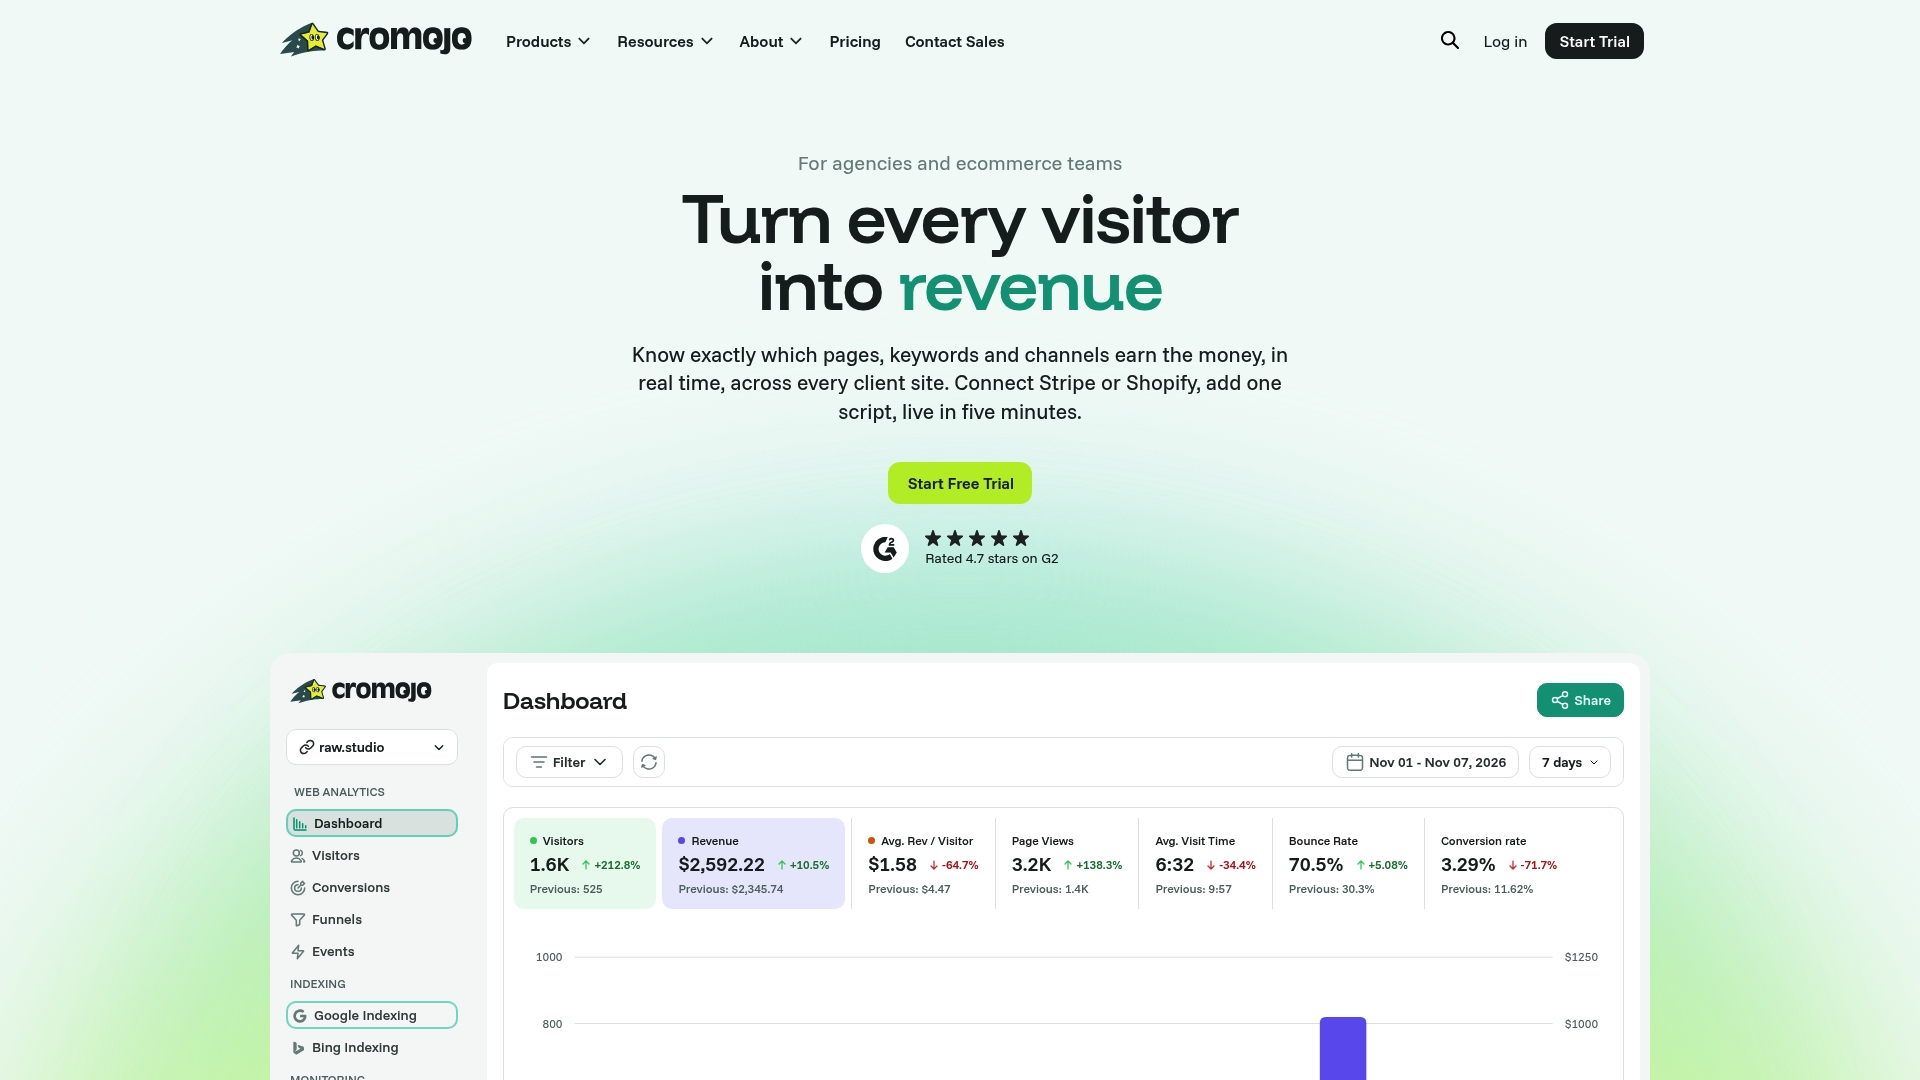
Setup takes less than a day for a typical e-commerce client: add the lightweight script, connect the commerce platform, map your conversions, and the first revenue-attributed report is ready within hours. White-labeled PDF exports mean every deliverable carries your agency brand. Automated anomaly detection means your team catches issues before clients do.
For agencies ready to move from traffic reporting to revenue reporting, start with Cromojo's revenue attribution feature or explore the full platform at cromojo.com.