
Ecommerce segmentation analytics compares defined groups of visitors or customers using consistent measures of behaviour and value. Overall averages can hide useful differences, but segment differences are descriptive: they do not establish why people buy or whether a campaign caused revenue.
This guide walks through what the research says, which segmentation methods are worth your time, how to build and validate segments, and where teams go wrong.
What ecommerce segmentation analytics actually is
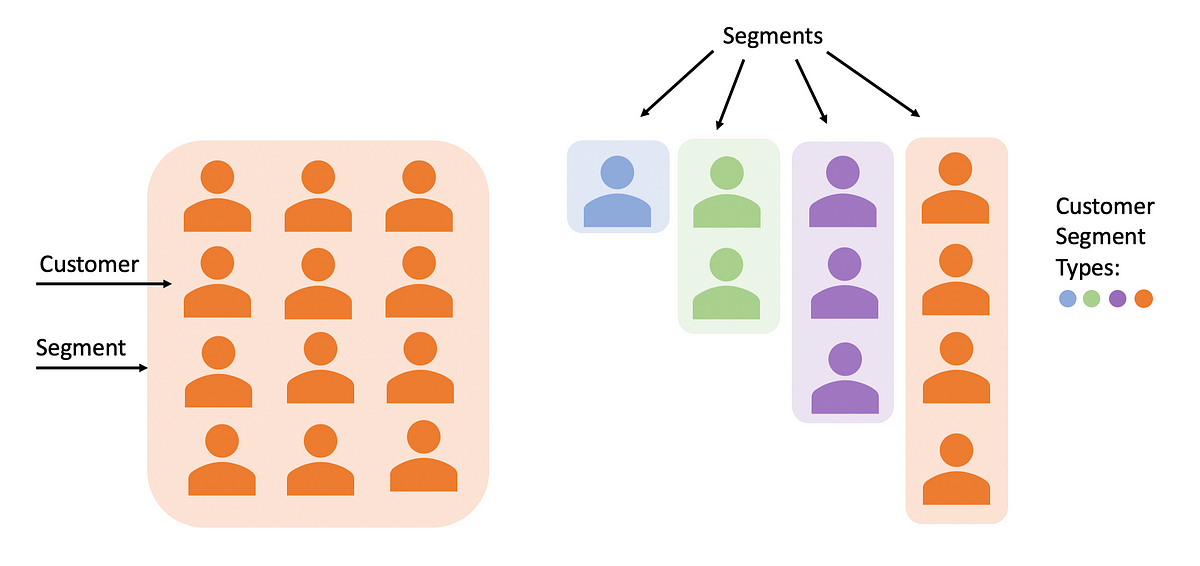
A 2023 review of customer segmentation methods describes the work as a sequence: collect customer information, represent each customer with selected features, analyze customers into more homogeneous groups, and use the results to target them with recommendations, campaigns or pricing strategies. The review covered 105 publications from 2000 to 2022, so it reflects how the field has actually been practiced, not one vendor's opinion.
Two things are worth noticing in that definition. First, segmentation is not the same as reporting. A report tells you that revenue fell last week. Segmentation analytics tells you which group of customers stopped buying, or which traffic source stopped sending buyers.
Second, the last step is action. A segment nobody targets, tests or monitors is a spreadsheet tab. The value comes from changing what you do for each group.
Why it matters for revenue
Amazon's guide to building customer segments lists the benefits merchants usually expect: sales growth, better marketing promotions, more efficient advertising spend, an improved customer experience, better product decisions and stronger retention. For a small store, the most concrete benefit is usually the middle one. When you know which groups buy, you stop paying to reach the ones who do not.
The four phases of a segmentation project
The Springer review frames ecommerce segmentation as four phases. They make a good project plan, and each one maps to a question you can answer.
- Data collection. What do we know about visitors and buyers?
- Customer representation. Which attributes describe them (for example RFM scores, product category, channel)?
- Segmentation analysis. How do we group them (rules, RFM bands, clustering)?
- Targeting. What do we do differently for each group, and did it work?
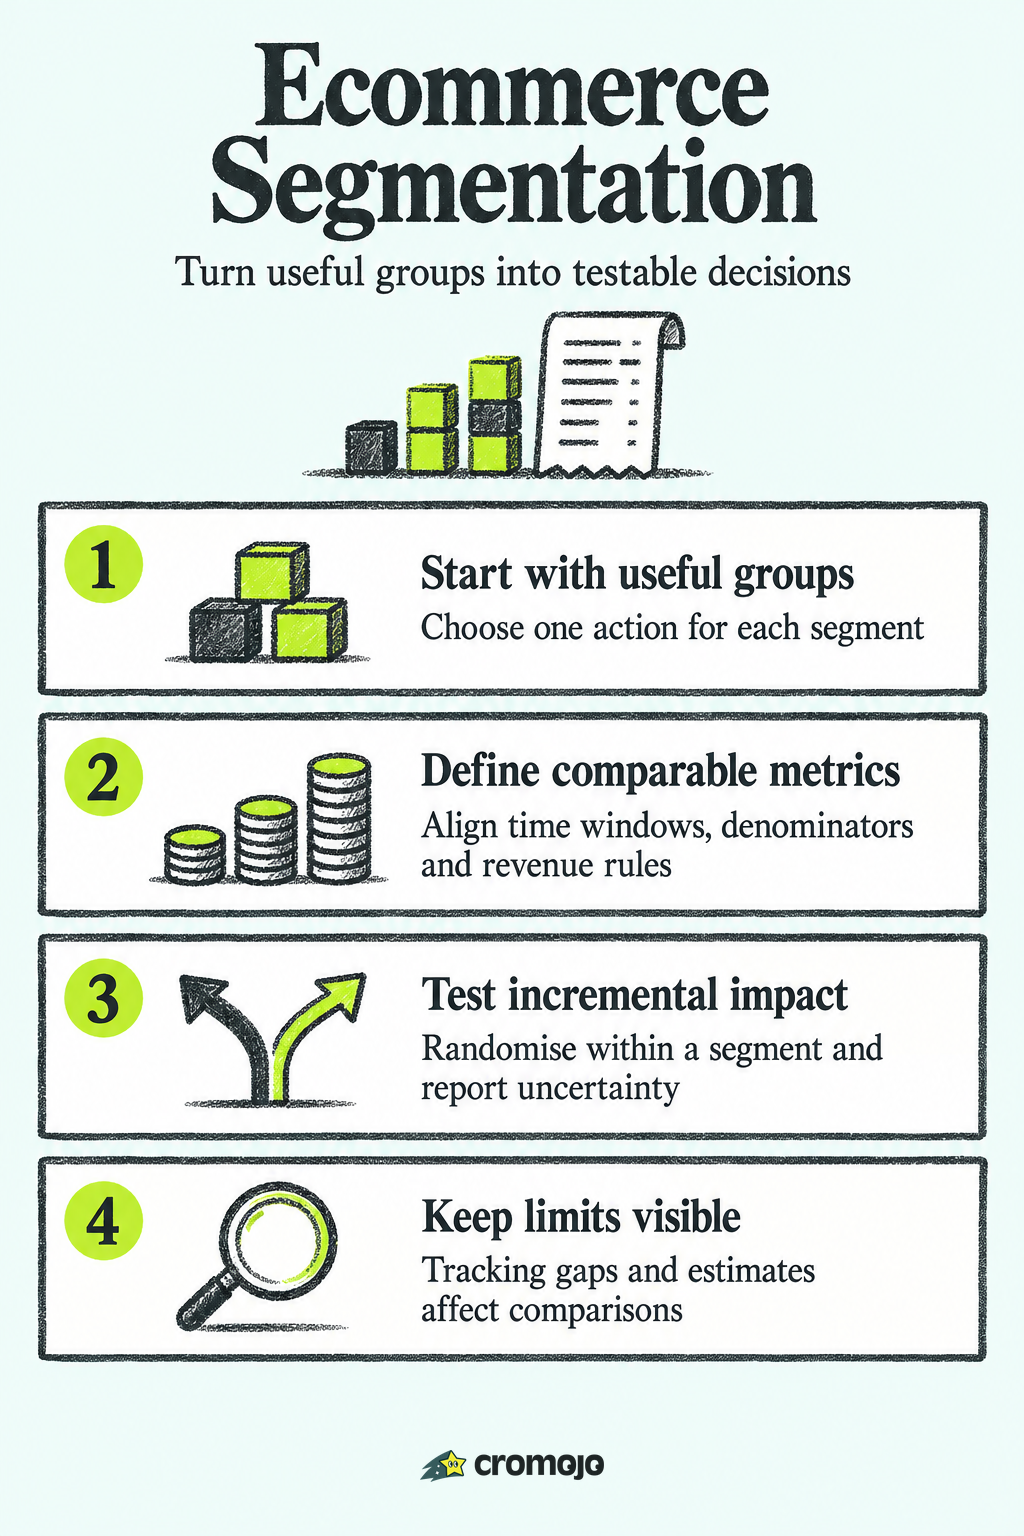
Start with a small feature set tied to a decision. Add attributes only when they improve interpretation, action or validation; the right number depends on the question and available data.
Step 1: Collect the right data
According to the review, useful inputs include purchase information, product views, clicks, purchased items and product categories, ratings and reviews and, where available, demographic or survey data. Notice how much of that is behavioral. You do not need a customer's age or income to start. What they bought and how they arrived tells you plenty.
Amazon's guide adds website signals: page views, unique visitors and bounce rates, combined with device and region, plus email and social engagement viewed together rather than in isolation.
In practice, a workable starting dataset for a store looks like this:
- Orders: order date, order value, items and categories, discount used, whether it was a first or repeat purchase.
- Traffic: source and channel, landing page, search keyword where available, device, country.
- On-site behavior: pages viewed, products viewed, cart and checkout steps reached.
- Engagement: email opens and clicks, social referrals.
Connecting traffic and purchases requires a supported tracking and checkout reference. Inspect matched and unmatched orders, rather than assuming every sale has a known journey. Cromojo connects recorded activity to eligible Stripe or Shopify purchases; organic keyword revenue is estimated from Search Console click share, not matched directly to individual buyers.
A note on data you may not have
Check completeness and measurement error in every input. Survey responses can be missing or inaccurate, while click and purchase data can contain duplicates, identity gaps or instrumentation faults. Neither observed nor self-reported data is automatically reliable.
Step 2: Choose a segmentation method
The same review found that manual feature selection and RFM analysis were the main ways to represent customers, and that k-means was the most commonly used clustering method. That matches what works for small and mid-sized stores: start simple and add complexity only when you hit a wall.
There is no universal order-count threshold for choosing clustering. Assess the number of customers, features, missingness, stability and whether groups support a useful action. Rules and RFM are often easier to explain; clustering also needs scaling, validation and a refresh strategy.
RFM, step by step
RFM represents each customer by three numbers. Shopify's RFM guide defines recency as the time since the last purchase, frequency as the number of purchases in a defined period, and monetary value as total spending in that period, not average order value.
Here is a simple way to run it:
- Export orders for a window that matches your normal buying cycle. Shopify advises that the window reflect the typical purchase cycle and stay consistent across customers, so a store selling coffee beans and a store selling mattresses should not use the same window.
- Calculate the three values for each customer.
- Score each value from 1 to 5, with 5 as best (most recent, most frequent, highest spend).
- Combine scores into named groups.
A practical set of groups for a small store:
- Champions: high on all three. Reward them, ask for reviews, give early access.
- Loyal but quiet: high frequency, falling recency. A reminder or replenishment email often fits here.
- Big spenders, one order: high monetary, low frequency. Test a second-purchase offer.
- At risk: used to buy, now silent. Test a win-back message, and measure it (more on that below).
- New: one recent order. Guide them toward a second purchase.
The labels matter less than the fact that each group gets a different action and a different measurement.
Step 3: Go beyond customers to traffic and journey segments
Most advice on this topic focuses on buyers. But you also need to understand visitors who have not bought yet, because that is where acquisition decisions are made.
Useful visitor-level segments include:
- Channel: organic search, paid search, email, social, referral, direct.
- Entry page: visitors who start on a product page vs. a blog post vs. the homepage.
- Campaign or keyword: compare recorded campaign terms where available; treat organic query revenue as an estimate when it is allocated from aggregate search data.
- Device and country: mobile visitors often convert differently from desktop visitors, and regions differ in shipping costs and expectations.
- Funnel position: visitors who reached the cart but not checkout.
Illustrative example: two channels each record 10,000 sessions. If the store records 240 orders at $60 average order value for organic and 80 at $45 for paid social, their order totals are $14,400 and $3,600. Orders per session are 2.4% and 0.8%; call this a session conversion rate only if the numerator is converting sessions. Use the same dates, attribution rules and revenue definition. These totals do not establish incremental return or profitability.
Review landing pages within each channel, while considering visitor intent, product mix and assisted journeys. A higher attributed conversion rate can identify a question to investigate; it does not by itself prove where another dollar of investment will perform best.
Step 4: Measure each segment with the right metrics
A segment is only useful if you can say whether it is worth more attention. Shopify's ecommerce segmentation guide suggests evaluating segments with conversion rate, repeat-purchase rate, average order value, customer lifetime value, reactivation rate, unsubscribe or spam rate, discount redemption rate and margin impact.
AMP, an analytics consultancy, adds acquisition and efficiency measures to the list in its guide to validating lift by segment: revenue per customer, frequency of purchase, cost per acquisition, time to conversion, ROI and incremental revenue contribution.
You do not need all of them. Choose a short scorecard:
Note the discount and margin entries. A segment that converts well only with a 30% coupon may be less valuable than a smaller one that pays full price.
Prove incremental lift, do not assume it
An observed response rate is not incremental lift. Some customers may buy without a message. A randomised holdout from the same eligible segment can estimate the campaign's effect when assignment, outcome definitions, exposure and follow-up are designed appropriately.
Define the outcome, meaningful effect, sample plan and observation window before randomising. Analyse all assigned customers, not only responders, and report uncertainty plus costs or margin where relevant. A noisy result is inconclusive; do not repeatedly test until a favourable result appears.

Step 5: Turn segment insights into action
Shopify's guide lists the usual places segments pay off: email flows, discounts, upsells and cross-sells, social media, dynamic retargeting and website personalization. Measure each against the goal you set, not against open rates.
Some concrete pairings:
- Champions get early access and referral prompts, no discounts.
- First-time buyers get a post-purchase sequence that points to complementary products.
- Cart abandoners get a reminder, and the checkout steps they drop at get reviewed.
- Mobile visitors from social get a landing page built for small screens, tested against the old one.
- Search and landing-page findings can guide hypotheses for content and internal links. Separate observed page performance from estimated organic keyword revenue; submission does not guarantee indexing or sales.
At the sophisticated end, Amazon researchers published a 2024 paper on segment discovery that uses uplift modeling with constrained optimization. The idea is to target customers most likely to benefit from an intervention, not random customers or those with the highest raw response propensity. The authors report improvements over state-of-the-art targeting in two large-scale experiments and a production deployment. You will not build that on a small store's budget, but the principle carries over: aim at people whose behavior you can change, not at people who were going to buy regardless.
Step 6: Keep segments fresh
Segments are not permanent labels. Shopify notes that segments should be refreshed as behavior changes, for example when a customer moves from first-time to repeat buyer after a second purchase. Build that movement into your tools so nobody has to update lists by hand.
A simple maintenance rhythm:
- Weekly: check that automated segments are populating and that the biggest ones have not shifted sharply.
- Monthly: review the scorecard for each segment and retire any that you never act on.
- Quarterly: revisit the RFM window and scoring thresholds against your actual purchase cycle.
Pitfalls to avoid
- Too many segments. If you cannot name the action for a segment, merge it into another.
- Small or uneven samples. Precision depends on sample size, outcome variability and the effect being evaluated. There is no universal rule that 40 customers can never inform a decision. Show uncertainty and avoid strong conclusions from unstable estimates.
- Stale behavior. The Springer review points out that customer behavior changes. A segment built a year ago may describe customers who no longer exist.
- Confusing correlation with cause. A group of high spenders may be high spenders for reasons unrelated to your campaign. Use control groups.
- Weak attribution. If orders are not tied to the traffic that produced them, channel and keyword segments will mislead you.
- Privacy blind spots. Review identifiers, browser storage, purposes, retention and applicable visitor-market rules. Order-based, aggregate or cookie-free labels do not automatically remove personal-data or consent obligations. Do not collect sensitive attributes merely because a tool permits them.
Perspective: what we see in revenue segmentation
We build analytics for ecommerce teams and agencies, and one pattern keeps showing up: teams segment by what is easy to count, not by what pays. Sessions, bounce rate and pageviews are easy. Revenue by keyword, page and channel is harder, because it needs order data connected to visits.
A useful starting view for many stores is attributed revenue by recorded acquisition source and landing page. It can reveal questions without building elaborate profiles, but matching may still involve personal data or identifiers. Treat it as one prioritisation input rather than a universal first step or a prediction of causal return.
Only after that do we think RFM and behavioral groups are worth the effort. They are powerful, but they work best once you trust the underlying revenue numbers. And whatever you build, we would rather you start with three segments you act on than twenty you admire.
How Cromojo supports segmentation
Cromojo revenue analytics links recorded activity to supported purchases, with coverage dependent on tracking and checkout setup. Its cookie-free mode is the default; optional returning-visitor tracking uses cookies and browser storage. Review current segmentation, goals and funnel access, usage limits and integration requirements on the pricing page. Do not assume a built-in RFM or clustering workflow unless the selected plan explicitly supports it.
A short checklist to start this week
- Configure the supported checkout reference and validate paid orders, refunds, duplicate events and unmatched purchases.
- Build a revenue-by-channel and revenue-by-landing-page view.
- Pick an RFM window that fits your purchase cycle and score your customers.
- Choose three segments and one action for each.
- Hold back a control group on the first campaign.
- Review after the planned observation window, considering the purchase cycle and required precision, then refresh definitions with documented changes.