



Client reporting automation connects data sources to reusable templates and prepares reports on a schedule. For agencies, the practical goal is less repetitive production work and clearer reporting on revenue, conversions, and next actions. Reliable output still depends on definitions, reconciled source data, and a named reviewer.

Why should you automate client reporting?
Manual reports eat the hours your team could spend on strategy. Every cycle, someone exports numbers, pastes charts, rewrites the same commentary, and hopes nothing broke along the way. Automation replaces that routine with a pipeline you build once and refine.
The benefits show up on both sides of the relationship:
- Time returned to the team. Analysts spend their hours on testing and recommendations instead of formatting slides.
- Consistent, faster delivery. Clients receive reports on a consistent schedule and in the same layout every cycle.
- Business outcomes over vanity metrics. Experts in the 2026 CMO Survey report advise translating performance data into bottom-line impact, so revenue and conversions lead instead of impressions.
- Stronger stakeholder confidence. When a report answers "what changed, why, and what next," decisions get made faster.
Which components do you need to automate first?
Reliable automated reports rest on four building blocks. If one is weak, the report inherits the weakness.
- Data connectors. Cover analytics platforms, ad platforms, ecommerce and payment systems such as Stripe and Shopify, and your CRM. Payment data matters most because it shows real revenue.
- A KPI framework. Pick metrics that map to each client's goals: conversion value, ROAS, and customer lifetime value. Fewer, sharper KPIs beat a wall of charts.
- Templates that separate layout from data.Best practice in automated reporting is to keep the layout apart from the data source, so the same design is reused each cycle and fresh numbers are merged in. That stops you from rebuilding a deck for every client.
- Integration hygiene. Map permitted identifiers, record attribution rules, and reconcile transactions across systems. Label modelled estimates and unknown sources separately; first-party or cookieless collection does not guarantee complete measurement or automatically remove privacy obligations.
Start with the source that records the client's business outcome. Payment records show transactions; linking them to pages or channels requires consistent identifiers and explicit attribution rules. Preserve unmatched records rather than forcing every sale into a marketing source.
How do you roll out automated client reporting step by step?
Treat the rollout as a short project with a clear order. Skipping ahead to scheduling before your data is trustworthy only automates mistakes.
- Plan. Meet the client stakeholders, define who reads the report, how often, and which outcomes they care about.
- Connect. Prioritize payments, ecommerce, and analytics connectors, then map identifiers so records line up.
- Build templates. Create a weekly operations view, a monthly performance view, and an executive one-pager, all in a consistent layout.
- Automate delivery. Schedule generation, exports, and distribution through email or shared folders.
- Verify. Add automated checks for broken sources, then require a human review before anything reaches the client.
- Iterate. Collect client questions after each cycle and fold the answers back into the template.
Pro Tip:Run the first two cycles in parallel with your manual process. Comparing both versions side by side exposes mismatched definitions before the client ever sees them.
The verify step deserves extra attention. Manual reporting often fails because of data discrepancies and broken sources, and a workflow where AI drafts the narrative and a person approves it reduces client-facing errors.

What features should you look for in reporting tools?
Judge tools by the friction they remove, not by how many charts they ship. We suggest scoring any platform against these capabilities:
- Connector reliability and breadth. Stripe, Shopify, ad platforms, and CRM connections should refresh without babysitting.
- Revenue attribution and modeling. The tool should assign revenue to a page, channel, or keyword, not just count sessions. Google's measurement guidance notes that no single method covers every need, so look for tools that combine attribution for daily optimization with room for incrementality checks.
- Narrative and anomaly detection. Flag unusual changes and draft possible explanations, but distinguish observed changes from hypotheses. An AI narrative is not evidence of causation.
- Templating, white-labeling, scheduling, and export formats. Agencies need branded output in PDF or email on a fixed cadence.
- Privacy controls and audit trails. Check collection, access, retention, deletion, and change logging for the actual implementation. A cookieless label alone is not a compliance assessment.
Be cautious about building your own stack from scratch. Industry voices writing for the American Marketing Association suggest partnering with established analytics platforms that can connect data across the customer journey, rather than maintaining custom pipelines.
What do weekly, monthly, and executive templates look like?
Cadence should follow the reader. Operations contacts want quick signals, while executives want impact and priorities. Here are three outlines you can copy.
- Weekly ops report. Open with one headline metric, then list the top wins and losses, a quick channel check, and the actions planned for the coming week. A single trend line and a short table are usually enough.
- Monthly performance report. Show revenue attribution by channel and page, trend analysis against the prior month, campaign learnings, and the tests you will run next. Add a short written explanation under each chart.
- Executive one-pager. Lead with revenue impact and ROI, follow with the top opportunities, and close with recommended priorities. Keep it to one page with one or two visuals.
For deeper dives, practitioners point to explorations and custom reports, such as path exploration in GA4, for the monthly analysis, while standard reports and custom tables surface quick findings for the weekly view. If a dashboard format suits your leadership audience, this guide to operational dashboards covers what leaders expect from scheduled reporting.
How do you keep automated reports accurate and trusted?
Automation scales errors as easily as it scales output, so governance matters. Build these safeguards into the workflow:
- Automated alerts. Trigger a warning when a connector fails or a metric moves outside a normal range.
- AI drafts, human approval. Let software write the first narrative, then require a named reviewer to approve it before sending. This is the review-before-send step.
- A single source of truth. Keep KPI definitions in one place and log every change, so "revenue" means the same thing in every report.
- An objection pre-mortem. Before sending, list the questions the client is most likely to ask and make sure the report already answers them. The CMO Survey guidance recommends this habit so reports address ROI proactively.
Pro Tip:Give the reviewer a short checklist: data freshness, totals matching the source system, and one sentence that states the main takeaway in plain words.
Clients also value answers more than charts. A narrative layer that explains what changed, why, and what to do next is what turns a data export into a report people act on.
How do you measure whether your reporting automation works?
Judge the system with a mix of operational and business signals, and name an owner for each.
- Time saved per reporting cycle. Compare hours before and after automation.
- Report error rate. Count corrections issued after delivery.
- Share of reports needing manual fixes. A falling number shows your connectors and templates are stabilizing.
- Client retention and satisfaction. Track whether clients stay and how they rate the reports.
- Speed of decisions. Note how quickly clients approve changes after receiving a report.
Turn client questions into fixes. Every recurring question points to a missing metric, an unclear chart, or a data gap, and each one should become a template or data update.
Finally, assign roles: a data owner for source accuracy, a report owner for templates and cadence, a narrative approver for the final sign-off, and a connector lead who watches integrations. Without named owners, quality slips quietly.
Where teams go wrong when scaling automated reports
The most common mistake I see is over-automation: teams schedule everything, stop reading what goes out, and a broken connector reaches the client before anyone notices. The second is KPI drift, where each account manager defines "conversion" a little differently. The fix for both is the same: a shared KPI glossary and a person who approves every report, even when the draft looks perfect. Speed comes from the pipeline, but trust comes from the review.
How Cromojo fits the automation playbook
Cromojo provides revenue-focused analytics and related reporting capabilities. Evaluate its current Stripe and Shopify integrations, site limits, export formats, refresh behaviour, and report delivery options against your workflow. Confirm which features are available in your plan rather than assuming it includes every scheduling, white-label, narrative, or audit requirement in this checklist.
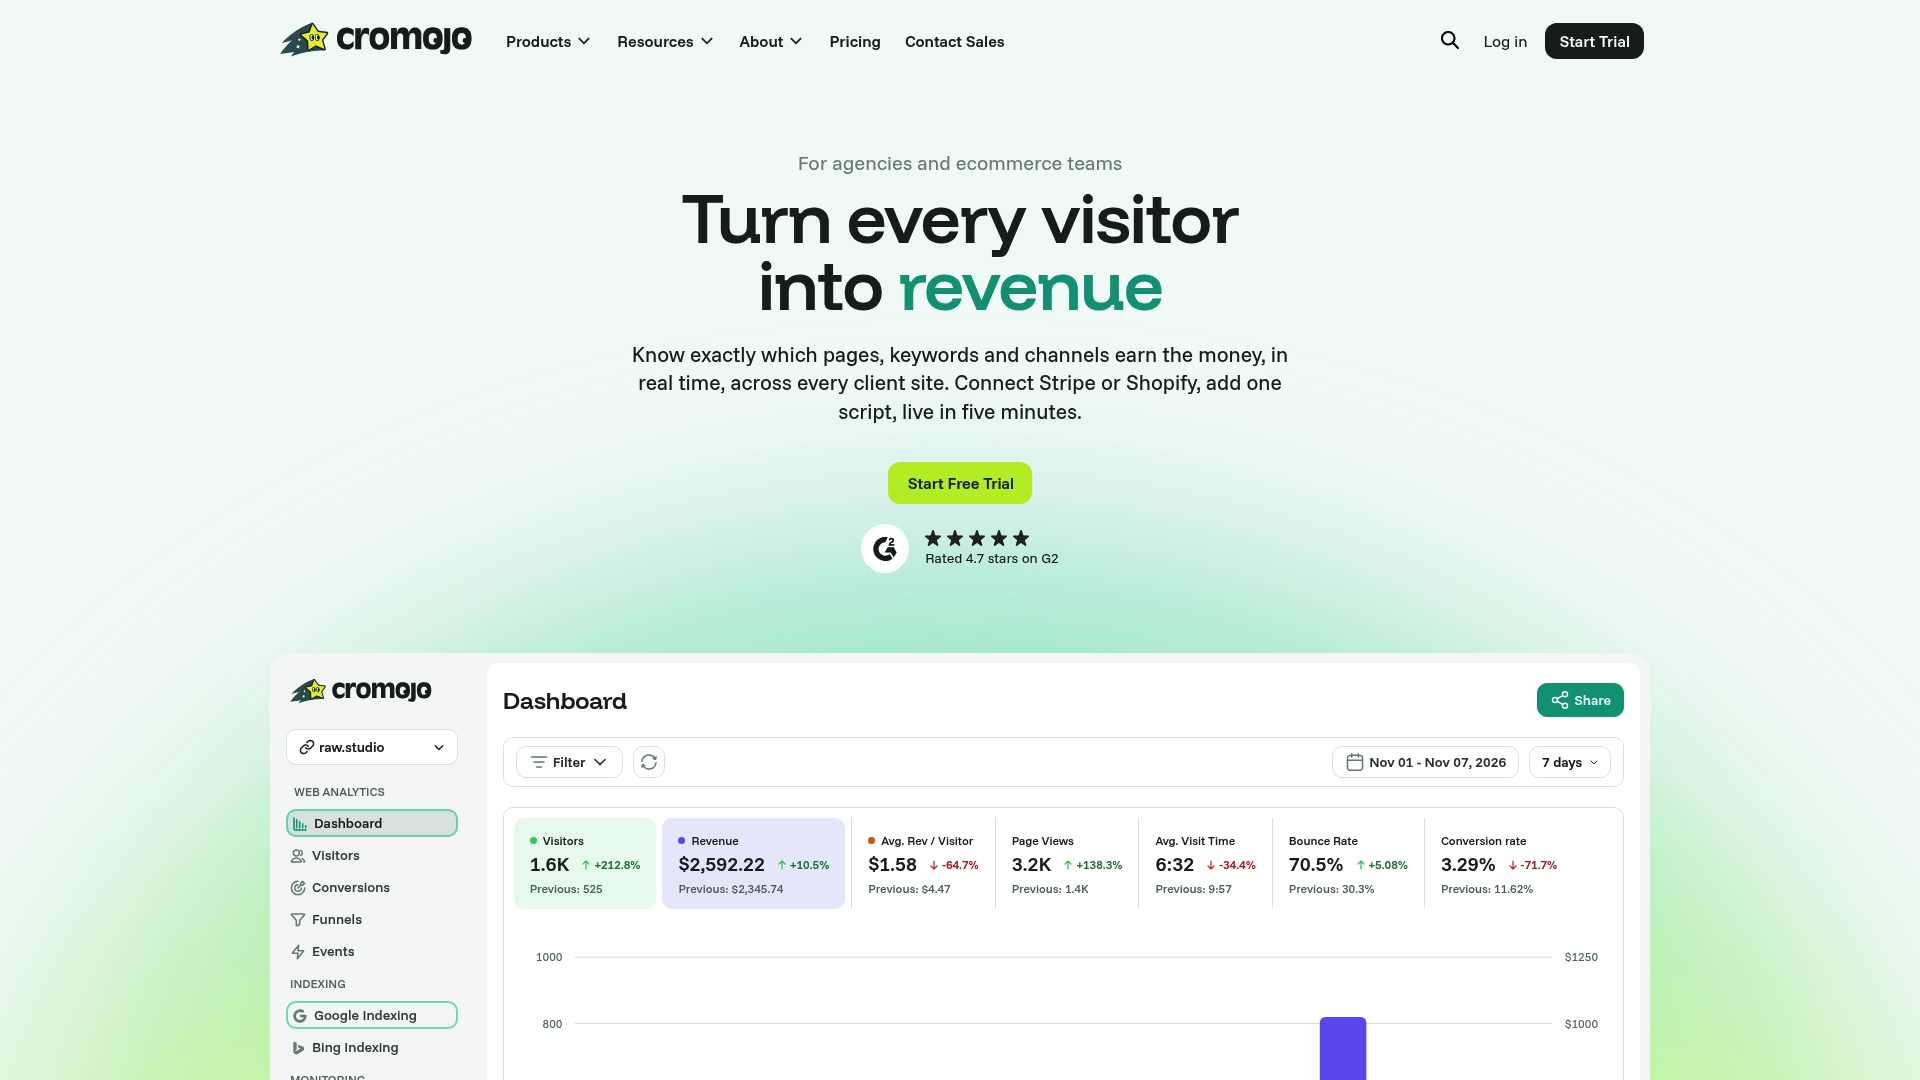
You can explore our revenue analytics and real-time analytics pages to check the fit, then compare Starter, Pro, Business, and Agency options on our pricing page. Our Starter plan is $19 per month. Start there, connect your first site, and see your next client report built around revenue.