



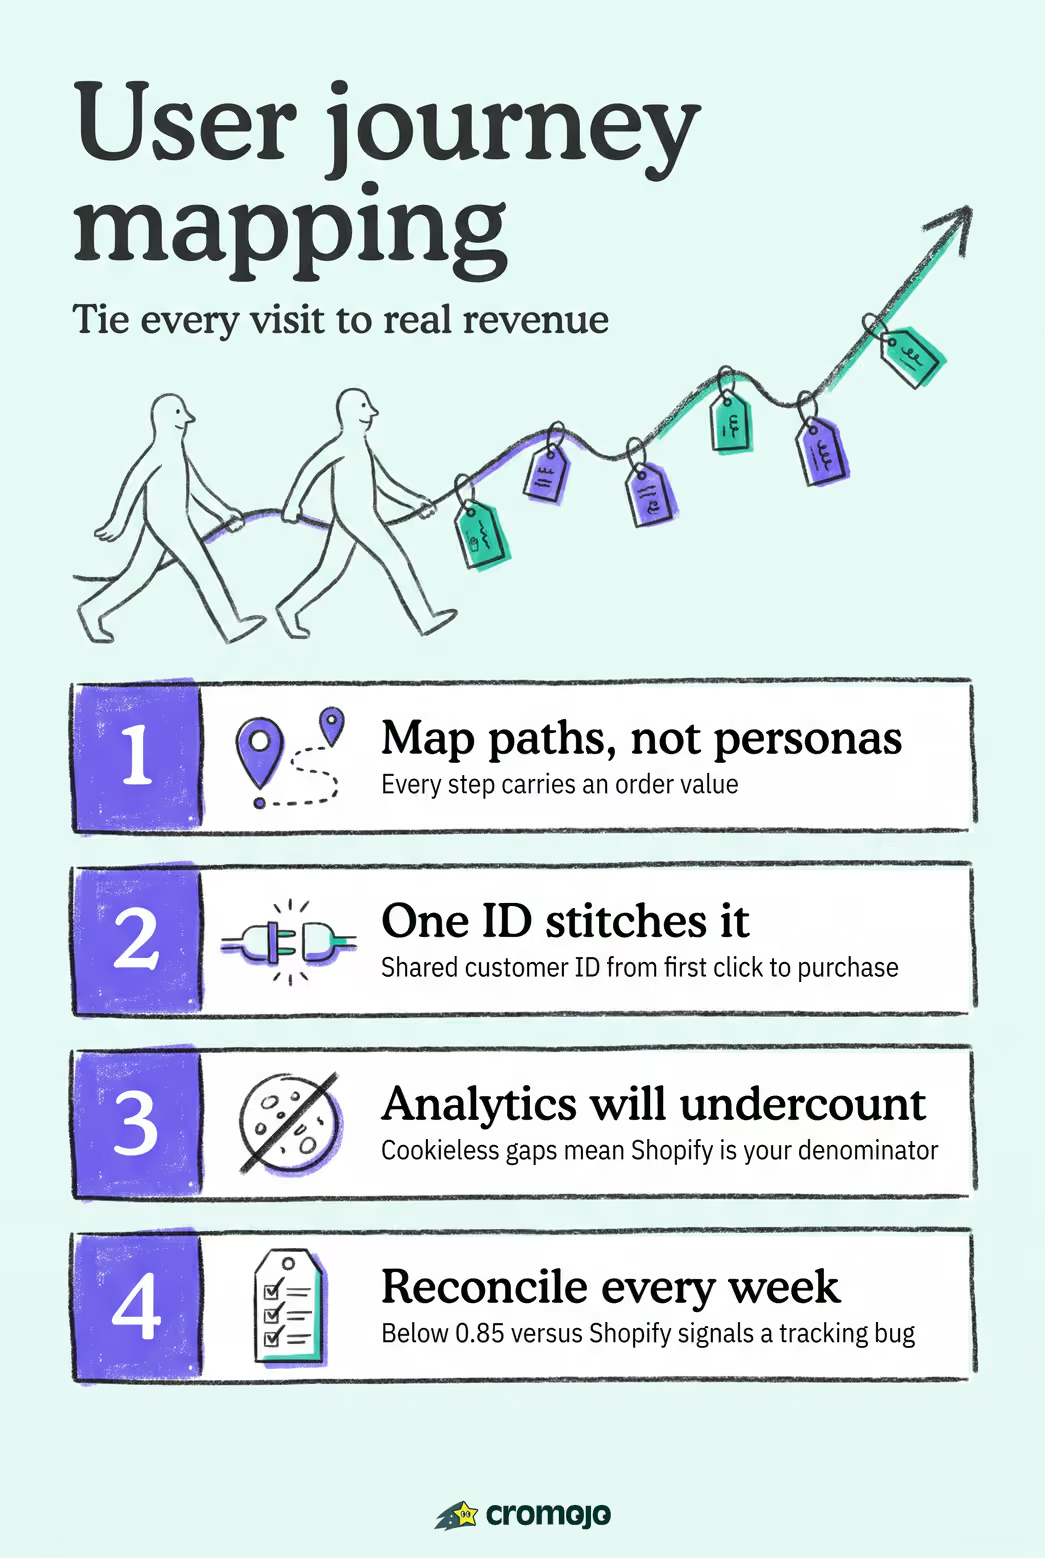
Revenue-focused user journey mapping means building a stitched, revenue-attached path using one shared customer ID, core ecommerce events from view_item through purchase, and Shopify or Stripe as your source of truth. That single principle separates maps that drive budget decisions from maps that collect dust.
What success looks like:
- Reconciled customer acquisition cost (CAC) that matches your Shopify/Stripe totals, not just platform-reported ROAS
- Checkout-completion rate improvement tracked to a specific funnel step
- lifetime value (LTV) to CAC ratio visible by channel
Start today with three steps:
- Run a touchpoint inventory across every channel and page type
- Pick one canonical customer ID (email hash or first-party ID)
- Pull a recent sample of orders from Shopify or Stripe for baseline reconciliation
Key Takeaways
Revenue-focused user journey mapping works only when your analytics-reported revenue reconciles to Shopify or Stripe weekly, everything else is directional at best.
What does "user journey mapping" mean for revenue analytics?
The term gets used two ways. UX designers use journey maps as empathy diagrams: personas, emotions, and service touchpoints sketched on a whiteboard. That is not what this guide covers. Here, user journey mapping is an analytics-driven practice: you instrument real events, stitch sessions to orders, and produce a data model that shows which paths generate revenue and which bleed it.
Think of it this way: journey mapping is the hypothesis; ecommerce analytics is the receipt that shows whether the hypothesis matched real purchase paths.
Scope of this guide: Shopify and Stripe order data, GA4-style event streams, UTM campaign data, CRM identifiers, and Google Search Console. The outcomes are attribution clarity, drop-off reduction, and LTV measurement, not persona diagrams.
Revenue-attached maps change how you allocate budget.
What data sources and integrations do you actually need?
Ecommerce analytics connects behavior to revenue through three layers: tag management (Google Tag Manager), an analytics platform (GA4 with enhanced ecommerce), and a marketing attribution layer. Add a customer data platform (CDP) only when first-party identity needs exceed what you can stitch manually.
Required data inputs, in priority order:
- Order-level revenue from Shopify or Stripe (order ID, revenue, customer email, timestamp)
- Event stream:
view_item,add_to_cart,begin_checkout,add_shipping_info,add_payment_info,purchase, plus one custom event for your single highest-friction step - UTM campaign data on every paid and email link, without it, paid social misattributes to direct
- Email or hashed customer ID passed consistently across sessions and devices
- CRM or lead stamps for stores with assisted or high-consideration purchases
- Google Search Console for keyword-level organic attribution
Integration priority:
- Start with Shopify/Stripe order exports
- Add client-side event collection (GTM + GA4 enhanced ecommerce) plus a server-side event API
- Connect CRM and Search Console last
A single shared customer ID is the linchpin. Without it, multi-session journeys fragment into disconnected anonymous visits and you cannot measure true CAC or LTV.
How do you implement revenue-focused journey mapping step by step?
Implementation checklist:
- Touchpoint inventory - list every channel, landing page type, and conversion point; assign an owner
- Define canonical events and ID - agree on event names, parameters, and the customer ID field before writing a line of code
- Deploy a lightweight tracking script - client-side via GTM plus a server-side event API for resilience against ad blockers
- Tag micro-conversions -
add_to_cart,begin_checkout,add_payment_infoin addition topurchase - Fire revenue on the confirmation page - sending revenue on button click inflates totals by capturing intent, not completed purchases
- Sync Shopify/Stripe order exports to your analytics warehouse weekly
- Run reconciliation - compare analytics-reported revenue to Shopify/Stripe totals and investigate gaps above 5%
Rough timeline:
Pro Tip:Use your last 1,000 orders as the calibration dataset. Map the first and last touch before each purchase to set your initial attribution baseline before you run any experiments.
Which attribution model should you use, and when?
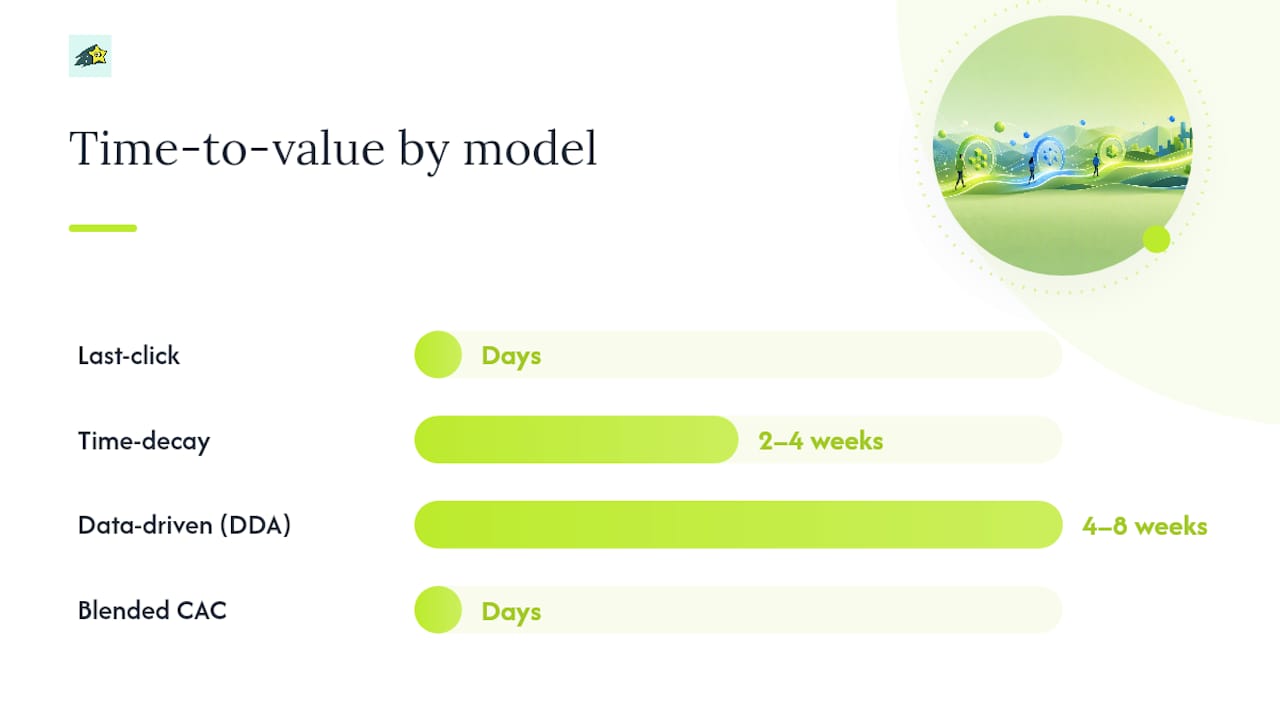
Data-driven attribution can reveal notably more channel contribution than last-click for brands with multi-session journeys, but it requires sufficient conversion volume to be reliable.
Metrics that tell the truth:
- Blended CAC - total marketing spend divided by total new customers from Shopify; your untouchable sanity check
- Checkout-completion rate - percentage of
begin_checkoutevents that reachpurchase - 90-day LTV - revenue per customer in the 90 days post-acquisition, by channel
- Assisted conversion count - how many purchases had a touchpoint from a given channel that was not the last click
Treat platform-reported ROAS from Meta or Google as directional only. Reconcile it to blended CAC from your Shopify and bank records before making any budget reallocation.
How do you read journey maps and turn them into experiments?
Start with these KPIs per segment: first-touch channel contribution, product-page-to-cart rate, checkout-completion rate, friction-point conversion delta by device, and 90-day LTV by acquisition source.
Experiment ideas mapped to common findings:
- High
add_to_cartbut lowbegin_checkout- test cart-page copy, urgency signals, or shipping cost transparency - Drop at
add_shipping_info- A/B test free-shipping thresholds or address-autofill UX - Mobile checkout-completion significantly below desktop - audit payment-step load time and form field count
- Paid channel shows high last-click ROAS but poor blended CAC - run an incrementality holdout to test true lift
For causality, compare a treatment group against a holdout group using Shopify revenue as the outcome variable. A revenue lift of even a few percentage points in checkout-completion compounds quickly at scale. Improving landing page trust signals is often the fastest lever when product-page-to-cart rates lag.
How do privacy changes affect journey mapping reliability?
Cookieless browsers, Intelligent Tracking Prevention (ITP), and ad blockers all degrade client-side data. GA4 client-side tracking can undercount transactions versus Shopify/Stripe by a noticeable margin depending on your setup. That gap is not a bug you can fully fix; it is a known constraint you plan around.
Practical workarounds:
- Prefer server-side event collection reconciled to Shopify/Stripe as your truth
- Use hashed email resolution to stitch cross-device sessions without third-party cookies
- Add a self-report field at checkout ("How did you hear about us?") for dark-funnel signals
- Instrument one custom event for your single highest-friction step so you have a reliable signal even when broader tracking degrades
Pro Tip:When cookies fail, first-party identity resolution plus a multi-method attribution stack (multi-touch attribution, media mix modeling, incrementality tests, and self-report) gives you the most complete picture of channel contribution.
Read your GA4 numbers knowing they likely undercount. Use Shopify as the denominator and treat the gap as a floor, not an error.
What does a revenue-mapping project typically cost and take?
Cost drivers:
- Engineering hours for instrumentation and server-side API setup
- Analytics platform subscription (GA4 is free; enhanced tooling adds cost)
- Data warehouse and connector fees if you centralize order and event data
- Third-party identity or CDP fees for high-volume cross-device stitching
- Agency implementation fees if you outsource instrumentation
Staffing minimum: one analytics or product owner, one developer for instrumentation, and one marketing owner to interpret results. Agency support compresses the timeline but adds cost.
The minimum viable stack for most stores is GTM, GA4, Looker Studio, and your ecommerce platform's native reporting. Add a CDP when cross-device identity needs exceed what manual stitching can handle.
What data pitfalls break journey maps, and how do you catch them?
Validation checklist:
- Deduplicate events, check for double-fired
purchaseevents on page reload - Confirm consistent event definitions across client-side and server-side collectors
- Test single customer ID continuity across logged-in and guest sessions
- Reconcile analytics revenue to Shopify/Stripe weekly; investigate any gap above 5%
- Audit UTM hygiene on every active campaign link
Common pitfalls:
- Double-counting conversions across ad platforms (Meta and Google both claim the same sale)
- Last-click bias hiding the true contribution of top-of-funnel channels
- Misfired
purchaseevents on checkout redirect pages before order confirmation - Cookieless undercounting treated as accurate rather than as a known floor
Pro Tip:Set a weekly reconciliation metric in your dashboard: analytics-reported revenue divided by Shopify revenue. Alert your team when that ratio drops below 0.85, it usually signals a tracking regression, not a sales drop.
How Cromojo mapped revenue journeys: a practical example
An ecommerce team using Cromojo connected Shopify order exports, Stripe payment events, and Google Search Console data through a single shared customer ID. Before instrumentation, checkout-completion rate was visible only as a blended number with no channel breakdown.

After deploying Cromojo's lightweight script alongside a server-side event API:
Connecting Shopify and Stripe as the revenue source of truth, then reconciling event data weekly, is what separates a journey map that informs budget decisions from one that just describes traffic. The channel-level CAC visibility alone changed how the team allocated paid spend within the first 30 days.
The integration list: Shopify order export, Stripe webhook, Google Search Console API, server-side event API, and a hashed email as the shared customer ID across all systems.
What should you do this week to get started?
Week 1 actions:
- Run a touchpoint inventory, list every channel, page type, and conversion event
- Export your last 1,000 orders from Shopify or Stripe with timestamps and customer email
- Define your canonical customer ID and agree on it across dev and marketing
- Tag the
purchaseevent server-side on the confirmation page
Weeks 2-4:
- Deploy client-side events (
view_itemthroughadd_payment_info) via GTM - Connect Google Search Console for keyword-level attribution
- Run your first reconciliation: analytics revenue versus Shopify revenue
First 90-day experiment cadence:
- Identify your top drop-off step from the event funnel
- Design one A/B test targeting that step
- Measure outcome using Shopify revenue in the treatment versus holdout group
Understanding how real-user monitoring feeds into journey analysis helps you prioritize which performance issues to fix first. Improving UX signals alongside organic search also strengthens the top-of-funnel data you feed into attribution models.
Why revenue-first mapping changes how teams operate
Most teams build journey maps and then wonder why the insights never change budget decisions. The reason is almost always the same: the map is disconnected from actual revenue. It shows sessions and pageviews, but not which paths produced the $47,000 in orders last month or which checkout step cost $12,000 in abandoned carts.
Revenue-first mapping flips that. When your Shopify truth is reconciled to your event stream weekly, every conversation about channel performance has a number behind it that nobody can argue with. Blended CAC is not a platform metric, it comes from your bank account divided by your Shopify new-customer count. That makes it immune to the attribution inflation that platform ROAS figures carry.
The teams that get the most from this approach are not the ones with the most sophisticated tooling. They are the ones that instrument fewer events more reliably, reconcile weekly without fail, and run one clean experiment at a time.
Cromojo gives you revenue attribution without the setup complexity
Cromojo connects directly to Shopify and Stripe, pulling order-level revenue into a dashboard that shows which pages, keywords, and channels actually generate sales. Conversion funnel reports, visitor journey analysis, and cookieless tracking are built in, no data warehouse required, no complex tagging sprints.
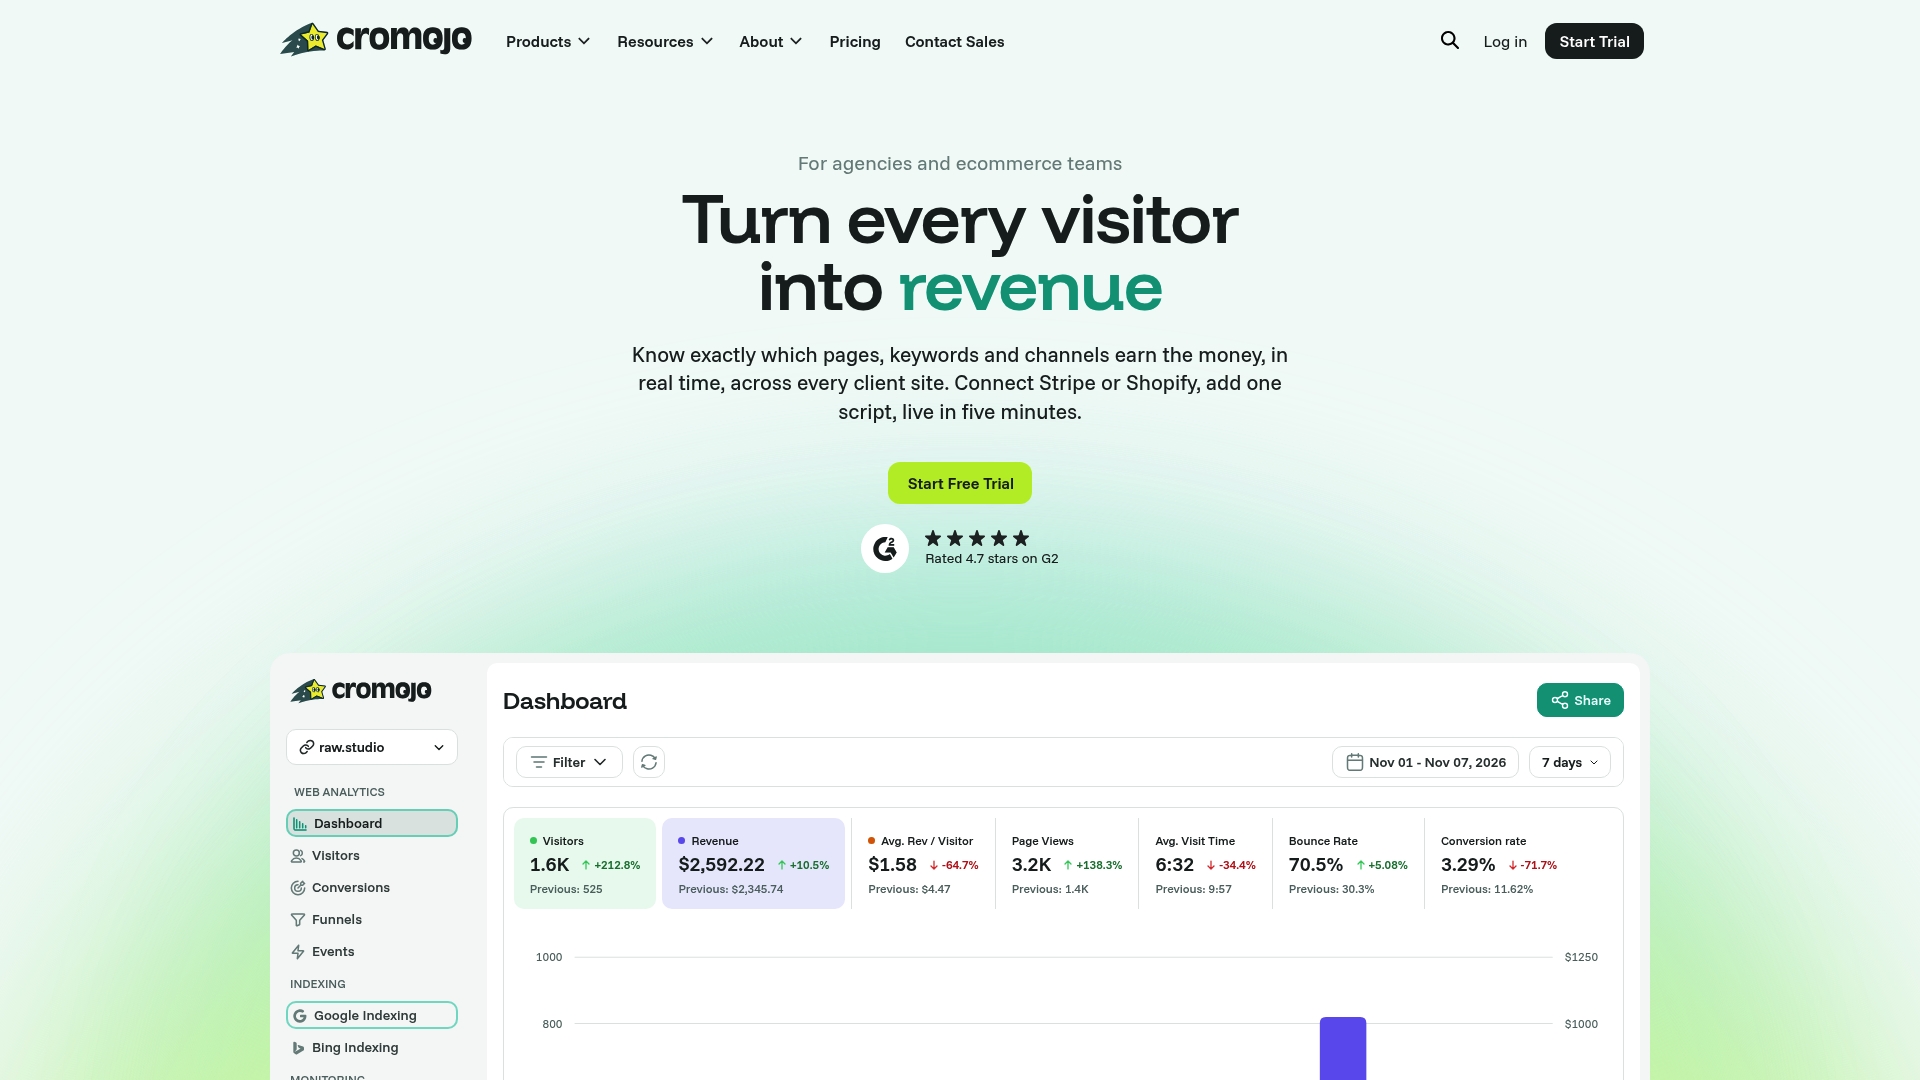
The platform's server-side reconciliation approach means your revenue numbers match Shopify, not just what client-side scripts capture. For agencies managing multiple client sites, Cromojo's segmentation and monitoring tools keep every journey map current and auditable.
Start attributing revenue to the right channels today. Visit the revenue attribution analytics page to see how Cromojo maps visitor journeys to real sales, or go straight to Cromojo to begin a free trial.