


Keyword conversion rate measures the percentage of clicks or visits from a specific keyword that complete a defined goal - a purchase, sign-up, or demo request. For paid search, expect a practical starting range of 2-5% across most industries; organic tends to run lower. Your first move: set up revenue-linked conversion tracking per keyword before you touch a single landing page. Optimizing without that baseline is guesswork dressed up as strategy.
Key Takeaways
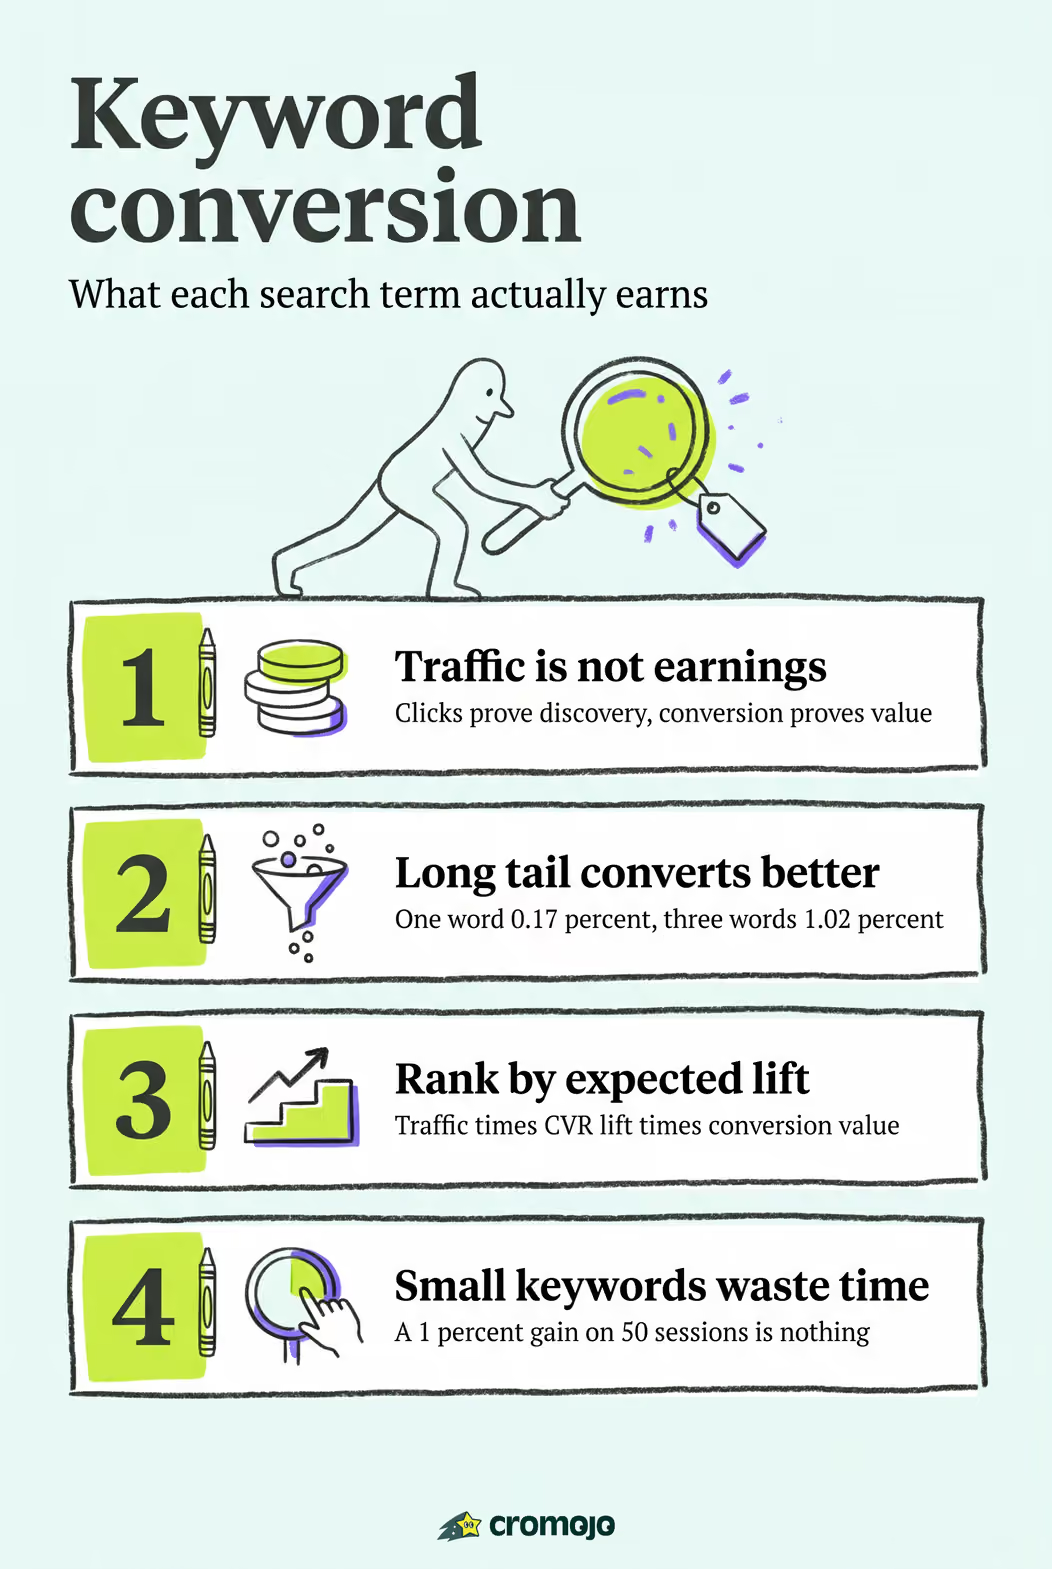
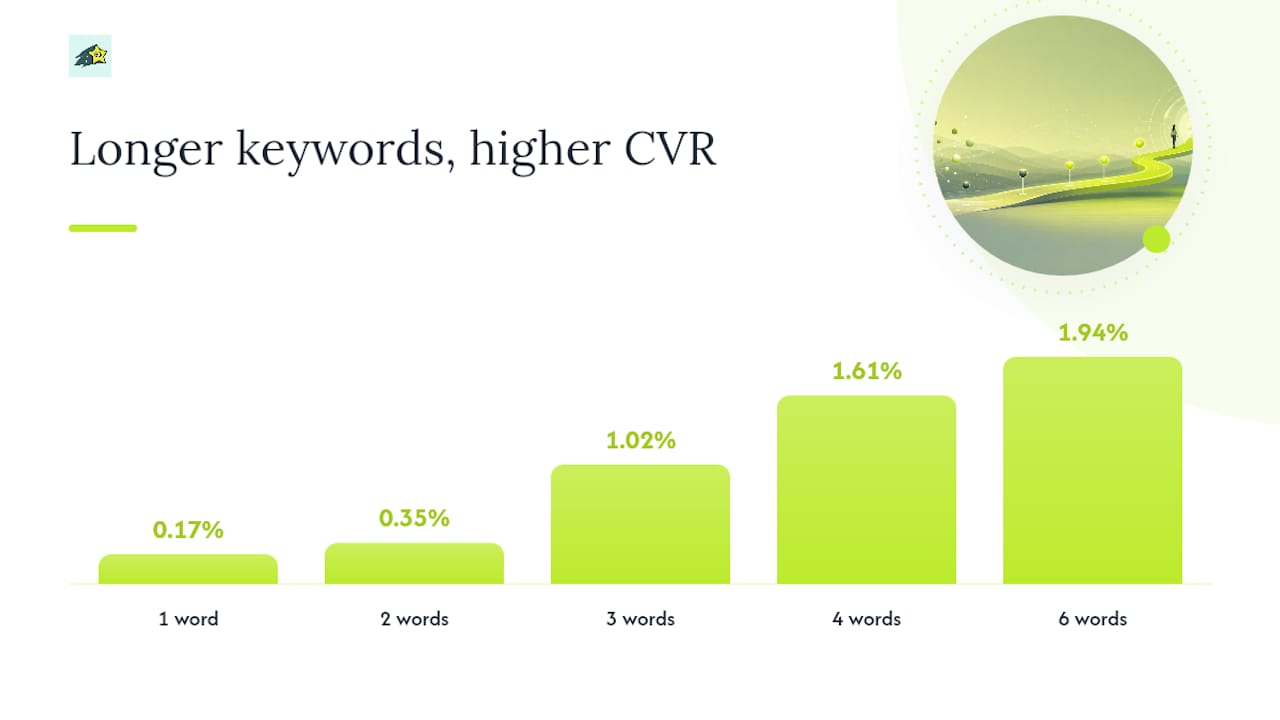
Long-tail keywords (3-7 words) convert at rates up to 11x higher than single-word queries, and connecting keyword tracking to actual revenue data is the fastest way to identify where optimization effort pays off.
What a keyword conversion rate actually measures
The industry term for this metric is conversion rate (CVR), measured at the keyword level. It tells you not just that traffic arrived, but whether that traffic did something valuable. Paid and organic CVR use different denominators: paid divides conversions by clicks, while organic divides conversions by sessions or users.
What counts as a conversion? That depends on your business model, but common events include:
- Primary conversions: purchase, subscription sign-up, demo request, form submission
- Micro-conversions: add-to-cart, email capture, PDF download, video play, pricing page visit
Choose one primary conversion event per keyword group. Tracking too many events at once muddies the signal. For ecommerce, revenue per session is often more useful than a raw conversion count because it weights high-value orders appropriately.
CVR vs. CTR: why both matter
CTR (click-through rate) and CVR (conversion rate) measure different stages of the funnel. A keyword can have a strong CTR and a weak CVR, which usually means the ad copy promises something the landing page doesn't deliver.
Both metrics belong in your keyword performance analysis. CTR gets people to your page; CVR determines whether they stay and act.
How to calculate keyword conversion rate
The formulas are straightforward. The nuance is in choosing the right denominator and attribution window.
Paid keyword CVR:
Conversions ÷ Clicks × 100
Example: A Google Ads keyword generates 400 clicks and 14 conversions in 30 days. CVR = 14 ÷ 400 × 100 = 3.5%.
Organic keyword CVR:
Conversions ÷ Sessions × 100
Example: A landing page tied to the organic keyword "best project management software for agencies" receives 620 sessions and 11 goal completions. CVR = 11 ÷ 620 × 100 = 1.77%. The SEO conversion rate formula follows this same structure: conversions divided by visitors, multiplied by 100.
Attribution windows matter more than most teams realize. A 7-day attribution window will show fewer conversions than a 30-day window for the same keyword, simply because some buyers take longer to decide. If you switch windows mid-test, your CVR numbers become incomparable. Pick a window that matches your average sales cycle and hold it constant.
Statistic callout: Moving a conversion rate from 3% to 3.5% on a page with steady traffic raises revenue by roughly 17% in a given scenario - a reminder that small percentage lifts compound quickly at scale.
What "good" looks like by keyword length, intent, and page type
Benchmarks are only useful when you know what's driving the variance. Three factors dominate: keyword length, search intent, and page type.
Keyword length and CVR
Neil Patel's aggregated data shows a clear pattern: longer queries convert better because they signal more specific intent.
Intent-based benchmarks
- Transactional keywords ("buy," "order," "get a quote"): highest CVR, often 3-8% for well-matched paid landing pages
- Commercial investigation keywords ("best," "review," "vs"): moderate CVR, 1-3%, depending on how well the page closes the comparison
- Informational keywords ("how to," "what is"): lowest CVR, typically under 1% for direct purchase goals, though micro-conversions (email sign-ups) can be higher
Page type also shifts the baseline. Dedicated landing pages built around a single keyword and offer consistently outperform product category pages, which outperform blog posts for direct purchase conversions. Matching page content to keyword intent is one of the highest-leverage moves in keyword performance analysis.
A note on sample size: CVR benchmarks from small datasets mislead. A keyword with 50 clicks and 3 conversions shows a 6% CVR, but that's noise, not signal. Require at least 200-300 clicks before drawing conclusions about a keyword's true conversion rate.
How to measure conversion rate per keyword
Paid and organic measurement require different setups, and both have real limitations worth knowing upfront.
Paid keyword tracking checklist:
- Set up conversion actions in Google Ads (purchase, lead form, phone call) and verify the tag fires correctly
- Use auto-tagging or manual UTM parameters to pass keyword data through to your analytics platform
- Import offline conversions if your sales cycle includes a phone or CRM step
- Check Quality Score components (ad relevance, landing page experience, expected CTR) - a low Quality Score often predicts poor CVR before you even check the data
- Use negative keywords to filter irrelevant traffic that inflates click counts without converting
- Review attribution reports in Google Ads to understand which keywords assist vs. close conversions
Organic keyword tracking - realistic approaches:
Exact keyword-level attribution for organic is harder because Google withholds most query data under "(not provided)." Practical workarounds include:
- GA4 custom events: fire events on goal completions and segment by landing page URL, then map URLs to their primary keyword targets
- Google Search Console + GA4 join: connect both properties to see which queries drive clicks to which pages, then cross-reference with conversion data by page
- Landing page URL mapping: if each keyword group has a dedicated landing page, page-level CVR is a reliable proxy for keyword CVR
- UTM strategies for paid social or email: when you control the traffic source, UTM parameters give clean keyword-level attribution
Common blind spots:
- "(Not provided)" hides the majority of organic query data
- Cross-device journeys break single-session attribution
- Cookieless browsers and privacy settings reduce observable conversions
For organic, monitoring data can reveal conversion drop-off points even when keyword-level data is incomplete - page-level error rates, slow load times, and crawl issues all suppress CVR in ways that show up in monitoring before they show up in your conversion reports.
How Cromojo attributes revenue to keywords
Most analytics tools tell you which keywords drive traffic. Cromojo tells you which keywords drive revenue. That distinction changes how you prioritize.
Cromojo connects keyword signals from Google Search Console to actual revenue events recorded in Stripe or Shopify. When a visitor arrives from an organic or paid keyword, completes a purchase, and that order is confirmed in your payment platform, Cromojo attributes the revenue to the originating keyword and page. No manual joins, no spreadsheet gymnastics.
Key features relevant to keyword-level attribution:
- Revenue attribution by keyword and page: see which keywords generate actual sales, not just sessions
- Conversion funnels: identify where keyword-driven visitors drop off before completing a goal
- Visitor journey analysis: trace the path from first keyword touch to purchase
- Cookieless tracking: privacy-first measurement that doesn't rely on third-party cookies, so your keyword CVR data stays accurate as browser privacy defaults tighten
- Integrations: Stripe, Shopify, and Google Search Console connect directly, giving you a single view of keyword performance and revenue
The cookieless approach matters specifically for keyword attribution. As browsers restrict cookie-based tracking, platforms that depend on cookies undercount conversions, which makes keyword CVR appear lower than it actually is. Cromojo's cookieless method captures conversions that cookie-dependent tools miss.
Pro Tip: Connect your Shopify or Stripe account before you run any keyword experiments. Revenue-linked attribution from day one means your CVR data reflects actual business outcomes, not proxy metrics.
How to prioritize which keywords to optimize first
Not every keyword deserves the same attention. A simple prioritization framework keeps you focused on the highest-revenue opportunities.
The core formula:
Expected revenue impact = Expected CVR lift × Monthly traffic × Value per conversion
Score each keyword candidate on two dimensions: expected revenue impact and optimization feasibility (how much technical, content, or design work is required).
Short numeric example:
Keyword A produces a larger expected lift with less effort. That's where you start.
Practical prioritization rules:
- Prioritize keywords that already generate some revenue - they have proven demand and a shorter path to improvement
- Product and category keywords typically outperform informational keywords for direct revenue impact
- Keywords with high traffic but low CVR relative to their intent signal a landing page mismatch, not a traffic quality problem
- Use keyword intent signals to separate "ready to buy" from "still researching" before you invest in a page rebuild
High-impact CRO tactics that move keyword CVR
Tactics that lift CVR work best when they're matched to the specific keyword's intent. A tactic that works for a transactional keyword may be irrelevant for a commercial investigation query.
High-impact tactics by category:
- Page speed: slow pages kill CVR before a visitor reads a word. A one-second delay in load time measurably reduces conversions on mobile
- Form length: every additional field reduces completion rates. Cut forms to the minimum required for your sales process
- CTA clarity: one primary CTA per page, with copy that matches the keyword's intent ("Get my free quote" beats "Submit" for a transactional query)
- Social proof:online reviews influence purchase decisions significantly - placing star ratings and review counts near the CTA reduces hesitation at the moment of decision
- Pricing clarity: hiding pricing creates friction. If your keyword targets buyers ready to compare costs, show pricing on the landing page
- Payment options: offering multiple payment methods (credit card, PayPal, buy-now-pay-later) reduces cart abandonment for ecommerce keywords
- Mobile UX: if more than half your keyword traffic arrives on mobile, your CVR ceiling is set by your mobile experience, not your desktop design
Personalization and keyword-to-page alignment:
The most reliable CVR lift comes from matching the landing page headline and offer directly to the keyword's intent. A visitor who searched "affordable CRM for small business" and lands on a generic CRM homepage sees a mismatch. The same visitor landing on a page that opens with "CRM built for small teams, starting at $29/month" sees confirmation. CRO is about removing friction and aligning experience to intent, not manipulating visitors.
Pro Tip: Before building a new landing page variant, check whether your existing page's headline matches the keyword's exact intent. A headline swap takes 20 minutes and often produces a measurable CVR lift within two weeks of traffic.
Pro Tip: For conversion rate optimization on high-traffic keywords, prioritize trust signals above the fold - a recognizable logo bar, a review count, or a security badge. Visitors decide whether to stay within seconds.
How to test and report keyword CVR improvements
Testing without a plan produces data you can't act on. A simple experiment framework prevents wasted cycles.
A/B test checklist for keyword-driven pages:
- Define one primary metric (CVR for the target conversion event) and one guardrail metric (bounce rate or revenue per session)
- Calculate required sample size before launching - most keyword-level tests need at least 200-300 conversions per variant to reach statistical significance
- Run one change at a time per page so you know what caused the lift
- Hold the test for at least two full business cycles (typically two weeks minimum) to account for day-of-week variance
- Confirm that traffic composition hasn't shifted during the test - a sudden influx of branded traffic will inflate CVR and make the variant look better than it is
Recommended dashboard KPIs:
- Keyword CVR (primary): conversions ÷ clicks or sessions, by keyword
- Cost per conversion (paid): total spend ÷ conversions, by keyword
- Value per visit: total revenue ÷ sessions, by keyword or landing page
- Revenue per keyword: total attributed revenue, sorted descending
- CVR trend over time: week-over-week or month-over-month to catch seasonal shifts
Reporting cadence: review keyword CVR weekly for active paid campaigns and monthly for organic. Quarterly reviews should compare keyword-level revenue trends, not just traffic. Stakeholders respond better to "Keyword X generated $14,000 in revenue last quarter, up from $9,000" than to "Keyword X improved CVR by 0.8 percentage points."
Attribute A/B test results to keyword performance by segmenting test data by the keyword group that drove traffic to the tested page. If your test page serves multiple keyword intents, segment results by intent group before drawing conclusions - a mixed-intent page can show a flat overall result while hiding a strong lift for one keyword segment and a drop for another.
The metrics that matter most are the ones tied to revenue
Most keyword CVR guides focus on averages and tactics. What they underemphasize is the sequencing problem: teams often optimize before they measure, which means they're improving a number they don't fully understand yet.
The most reliable wins come from a simple sequence. First, connect your analytics to a revenue source - Stripe, Shopify, or your CRM. Second, identify the 10-20 keywords already generating revenue, even small amounts. Third, optimize those pages before touching anything else. Keywords with existing revenue signal proven demand; they just need friction removed.
The caution worth stating plainly: chasing marginal CVR gains on low-traffic keywords can consume more time than the revenue lift justifies. A 1% CVR improvement on a keyword with 50 monthly sessions produces almost nothing. The same improvement on a keyword with 2,000 sessions and a $150 average order value is worth pursuing. Cromojo's keyword-level revenue attribution makes that prioritization visible without manual calculation.
Cromojo gives you keyword-level revenue visibility from day one
Knowing which keywords generate revenue - not just traffic - is the practical gap most analytics setups leave open. Cromojo closes it by connecting keyword signals directly to Stripe and Shopify revenue data, so you can see which queries produce actual sales and which ones just fill your session reports.
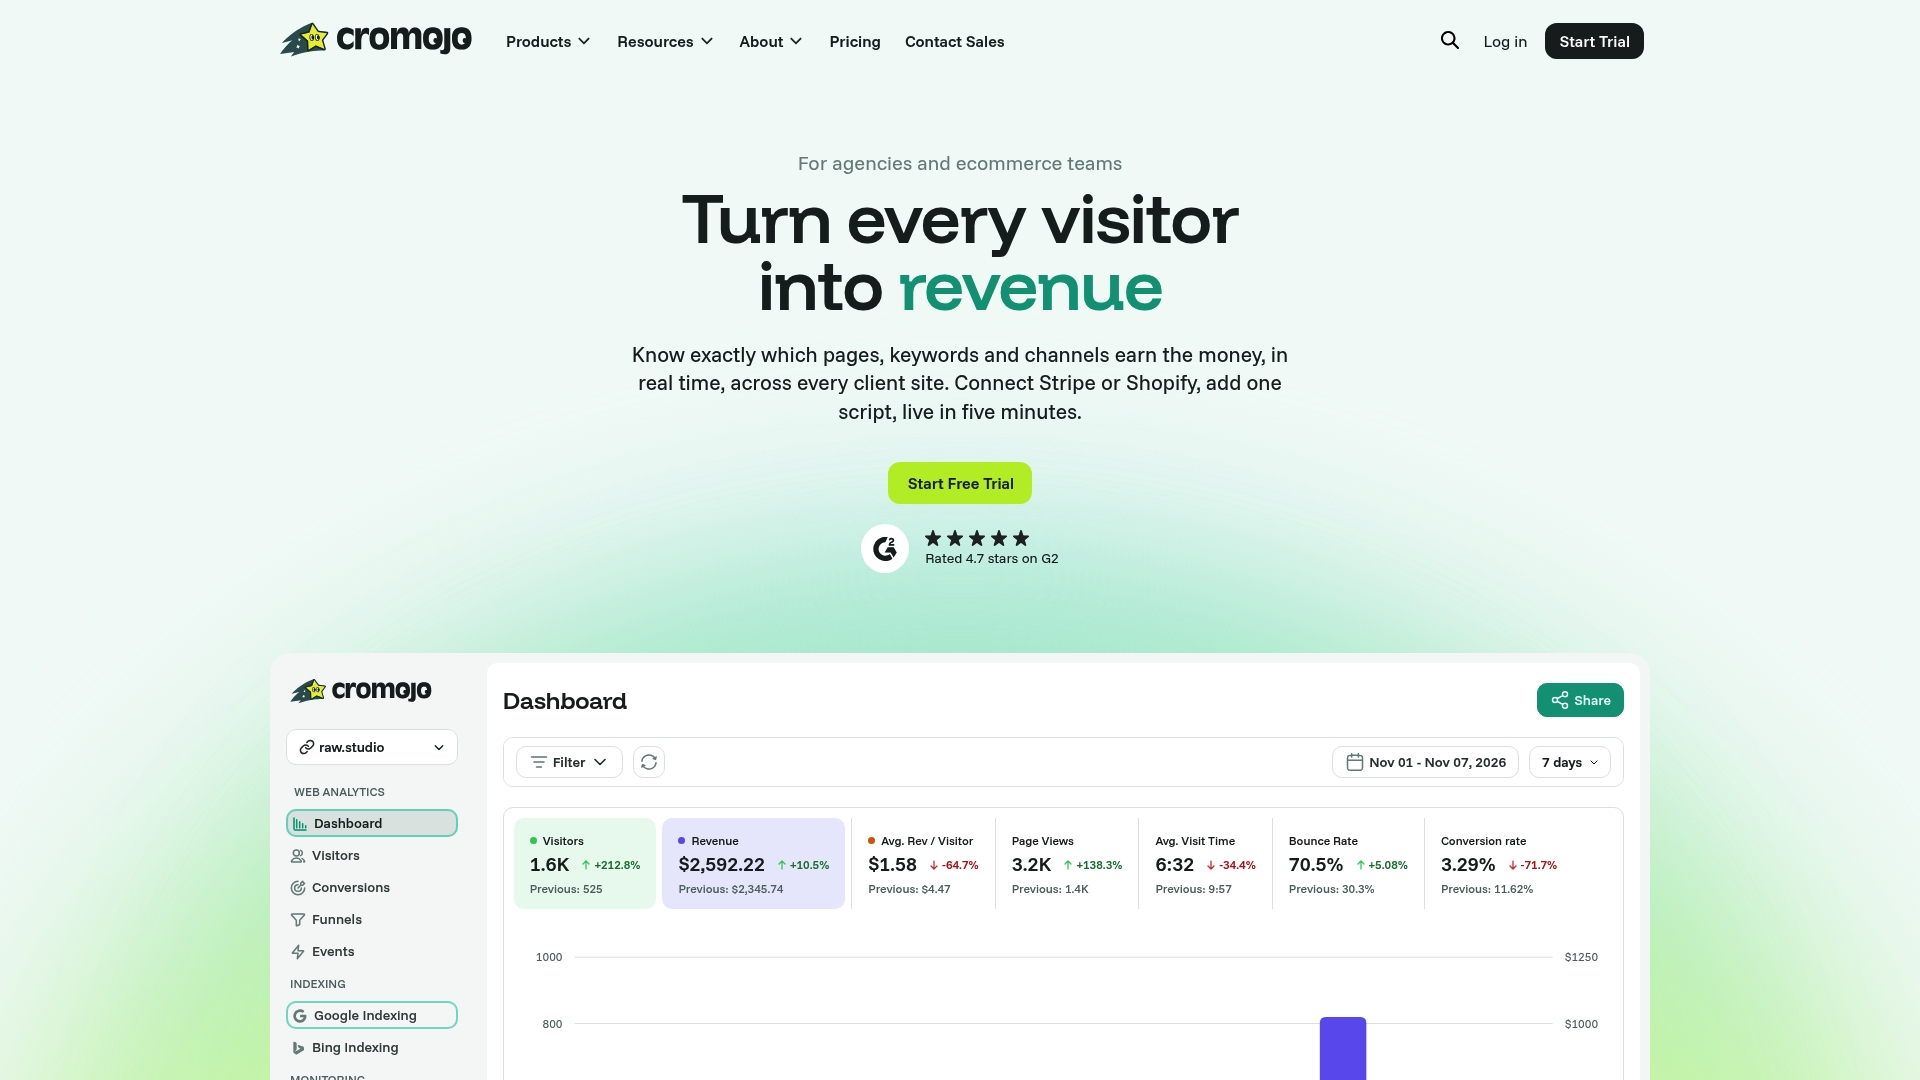
The platform tracks conversion funnels, visitor journeys, and keyword-attributed revenue in real time, with cookieless tracking that stays accurate as privacy defaults tighten across browsers. Setup takes minutes via a lightweight script, with no developer required. Integrations with Google Search Console, Stripe, and Shopify mean your keyword performance data and your revenue data live in the same place.
Ready to see which keywords are actually driving your revenue? Start with Cromojo's revenue attribution and know within days which keywords deserve your optimization budget.