


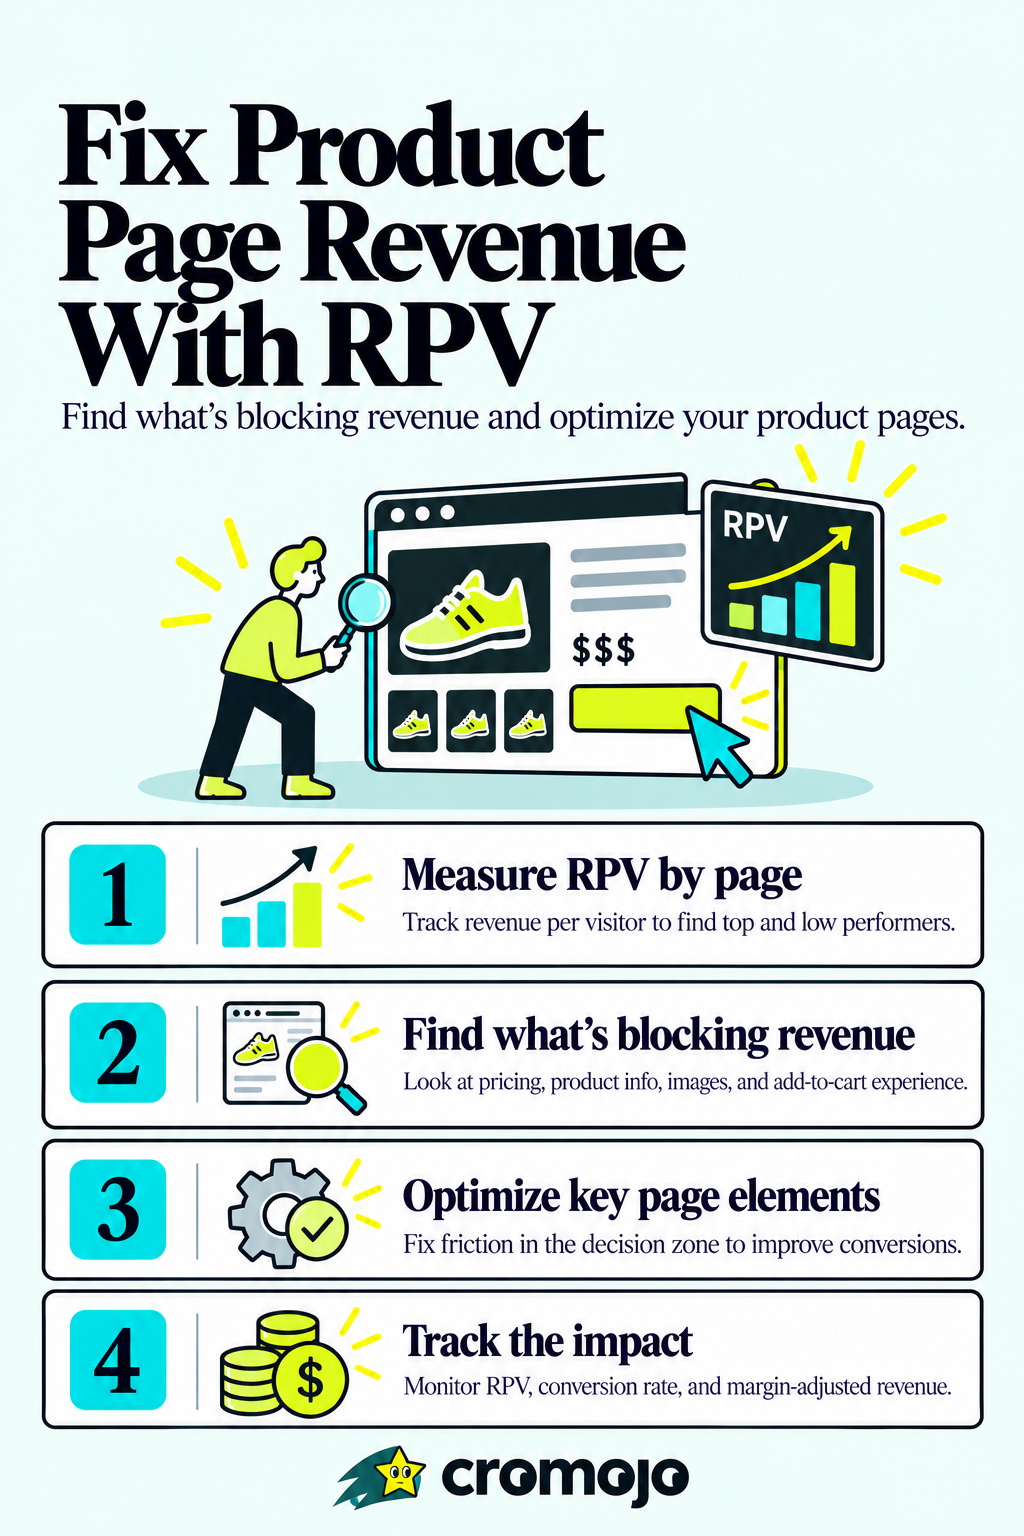
The fastest way to increase product page revenue is to measure revenue per visitor (RPV) by page, then fix whatever friction that number exposes. A page converting well but generating weak RPV usually has a pricing or upsell problem, not a traffic problem. Cromojo customers who start here typically find one or two pages responsible for a disproportionate share of lost revenue. The next section breaks down which page elements to fix first and how to measure the impact.
Anatomy of a Revenue-First Product Page
Every element on a product page competes for a visitor's attention, but only a handful directly move revenue. Nielsen Norman Group's research on ecommerce product pages identifies a short list of non-negotiables: a descriptive product name, images with enlarged or zoomed views, a visible price, current availability, and an unambiguous add-to-cart control. Everything else is supporting cast.
Think of the page in two zones. The decision zone sits above the fold and to the right on desktop, or stacked near the top on mobile. It answers "can I buy this, and how much does it cost?" in under two seconds. The consideration zone lives below, holding specs, sizing charts, shipping details, and reviews, for shoppers who need more convincing before they commit.
Each must-have element earns its place by reducing a specific kind of buyer doubt:
- Product name and description eliminate confusion about what's actually being sold, especially on mobile where thumbnails are small.
- Zoomable images answer "does this look like what I expect?" without requiring a return.
- Price removes the single biggest reason for cart abandonment: sticker shock discovered too late.
- Availability status prevents wasted clicks on out-of-stock items and signals urgency when stock is genuinely low.
- Add-to-cart button needs visible feedback the moment it's clicked. NN/g's lab testing found that shoppers frequently double-add items or abandon carts when the page doesn't confirm the action clearly, which quietly inflates return rates and support tickets.
Nice-to-have elements, things like extended warranty upsells, related product carousels, and trust badges, belong in the consideration zone. They can lift AOV, but they should never crowd the decision zone or delay the moment a ready buyer can click "buy." A page cluttered with badges above the price line is optimizing for trust signals at the expense of the one signal that actually converts: clarity.
Which Metrics Actually Map Product Pages to Revenue?
Conversion rate tells you how often people buy. It doesn't tell you how much money that page actually generates, and that gap is where most optimization roadmaps go wrong. Revenue per visitor, calculated as total revenue from a page divided by unique visitors, closes that gap by putting a dollar value on every visit, not just every sale. Brafton frames this as revenue per page, and it's the single most useful number for deciding which pages deserve engineering and design time.
RPV outranks conversion rate for prioritization because it accounts for both how often people buy and how much they spend. A page converting at 1% with a $10 price point is producing $0.10 per visitor. A page converting at 3% with a $200 average order is producing $6.00 per visitor, sixty times more valuable, despite a conversion rate that looks less impressive to a team fixated on percentages alone.
Build a ranked dashboard that moves through the full funnel: visitors, conversions, revenue, RPV, then margin-adjusted revenue after refunds and discounts. That last step matters. A page with strong RPV but a high refund rate might be overstating its real value.
MetricFormulaWhy it mattersConversion ratePurchases ÷ visitorsShows demand, not valueRevenue per visitor (RPV)Revenue ÷ unique visitorsRanks pages by actual dollar valueAverage order value (AOV)Revenue ÷ number of ordersShows spending per transactionAdd-to-cart rateAdd-to-carts ÷ visitorsFlags early-funnel frictionMargin-adjusted revenueRevenue minus refunds and discountsShows true profit contribution
A high-traffic page with a $15 impulse item can look like a star in a conversion-rate report while quietly underperforming a mid-traffic page selling a $150 accessory. Ranking by RPV instead of raw conversion percentage is how you avoid funding the wrong roadmap item.
How Do You Set Up Analytics to Capture Product Page Revenue?
Revenue attribution breaks more often from bad instrumentation than from bad strategy. GA4's purchase event is the backbone of ecommerce revenue reporting, and Google's own documentation is explicit that currency must be set at the event level, with the items array fully populated for every transaction. Skip either step and revenue reports quietly become unreliable, even though the dashboard still looks fine.
The most common data problems that corrupt page-level revenue tracking:
- Currency mismatches, where a checkout defaults to one currency code while the storefront displays another, silently distorting totals.
- Missing item arrays, which strip out product-level detail and make it impossible to tie revenue back to a specific product page.
- Promo parameter leakage, where discount codes get logged inconsistently, making margin-adjusted revenue calculations unreliable.
- Duplicate purchase events, often triggered by back-button navigation or page reloads on the confirmation screen.
Google's ecommerce measurement guidance also recommends enabling debug mode before trusting any report, since it surfaces missing parameters in real time rather than after a quarter of skewed data has already accumulated.
Run this diagnostic checklist before drawing conclusions from any revenue report: confirm currency is set on every purchase event, confirm the items array includes item ID, price, and quantity for every line, check that promo codes appear as a distinct parameter rather than being baked into price, and verify no duplicate purchase events fire on refresh. Tools like Cromojo's real-time analytics pair directly with Stripe and Shopify, which sidesteps a lot of this manual event plumbing by pulling revenue straight from the payment processor instead of relying purely on client-side event tracking.
Pro Tip: Run your GA4 debug view for a full checkout cycle, including a refund, before trusting any revenue-by-page report. A single missing parameter can understate a page's real RPV by double digits.
Do Photos, Video, and Reviews Actually Increase Revenue?
Media isn't decoration on a product page, it's a friction remover. Nielsen Norman Group's research shows that multiple product views, zoom functionality, 360-degree photography, and product video all reduce the uncertainty that keeps shoppers from clicking buy, and that same uncertainty is what drives returns after the sale. A shopper who can rotate a product or watch it in motion buys with more confidence and returns it less often, which means richer media pays twice: once in conversion, once in margin protection.
Review content works the same way, but only when it's built correctly. AI-generated review summaries have become common on product pages, and NN/g's research on the format is specific about what makes them trustworthy rather than suspicious. A summary needs to surface real themes, cite how many reviews mention each theme, include a sample quote or two, and link back to the original reviews so shoppers can verify the summary isn't inventing sentiment. A vague AI blurb with no sourcing does the opposite of building trust.
Practical priorities for the media and reviews section of a product page:
- Include at least three product images shot from different angles, with zoom enabled on all of them.
- Add product video for anything with a learning curve, assembly step, or fit concern.
- Place a review summary near the buy control, not buried below specs.
- Label AI-generated summaries clearly and link every summary to its source reviews.
- Show review count alongside star rating; a 4.6 from 1,200 reviews reads very differently than 4.6 from 9.
A/B test review placement the same way you'd test a price change. Moving a review summary above the fold versus keeping it in the consideration zone can shift RPV meaningfully, and the only way to know which version wins for your specific catalog is to test it rather than assume the "obvious" placement is correct.
What Pricing Tactics Increase Revenue per Visitor?
Price is not just a number, it's a framing exercise, and small changes to how it's presented move real revenue. Showing price-per-unit next to the total price (say, cost per ounce on a supplement bottle) helps shoppers compare value without opening a calculator, and anchor pricing, showing a higher "was" price next to the current one, gives context that a bare number lacks. Both belong directly next to the buy control, not in a footnote.
Total order cost should be visible before checkout, not revealed as a surprise at the final step. Shipping estimates, taxes, and any add-on fees shown near the price line prevent the abandoned-cart spike that happens when hidden costs appear too late in the funnel.
Bundles, cross-sells, and free-shipping thresholds are the three most reliable AOV levers:
- Bundles ("buy the case and the charger together") lift AOV when the bundle price beats buying items separately by a visible margin.
- Cross-sells placed near the add-to-cart button, not in a generic carousel at the bottom, convert better because they're seen before the buying decision is finalized.
- Free-shipping thresholds set just above current AOV nudge shoppers to add one more item, a tactic that works because the psychological cost of "leaving money on the table" outweighs the extra item's price.
Calculate expected AOV impact before rolling any of these out broadly. If free shipping kicks in at $75 and current AOV sits at $68, model how many shoppers are likely to add a $10 item to clear the threshold, then weigh that against the shipping cost you're absorbing. Track the result as margin-aware RPV, revenue minus the cost of the incentive, not gross revenue, or the tactic can look like a win while quietly eating margin.
How Much Mobile Friction Is Costing You Revenue?
Most product page traffic arrives on mobile, and most mobile product pages are still built like shrunk desktop layouts rather than mobile-first experiences. Baymard's benchmarking of ecommerce product pages found that a majority of sites deliver mediocre or worse UX, with mobile and in-app experiences scoring worse than desktop across the board. That gap is recoverable revenue sitting on the table for any team willing to fix it.
Three fixes consistently move the needle fastest:
- Compress and lazy-load images. Product photos are usually the heaviest assets on the page, and a slow-loading hero image costs conversions before a shopper even sees the price.
- Inline critical CSS for above-the-fold content. The decision zone should render before the rest of the page finishes loading, not after.
- Reduce server response time. A fast backend matters more on mobile networks, where every extra request compounds latency that desktop connections mask.
On the design side, the mobile decision zone needs the same discipline as desktop: price, availability, and add-to-cart visible without scrolling, and product options (size, color) presented as simple taps rather than dense dropdown menus that are easy to mis-tap on a small screen.
Pro Tip: Test your product page on a mid-range Android device over a throttled connection, not just your own phone on office WiFi. That's closer to what a meaningful share of your actual mobile traffic experiences.
How Do You Run A/B Tests That Prove Revenue Impact?
A test that moves conversion rate but not revenue hasn't proven anything useful yet. Structure every product page experiment around a clear chain: hypothesis, then a revenue metric like RPV as the primary outcome, then a sample size and runtime long enough to trust the result, then guardrails that catch a false positive before it ships broadly.
- Write the hypothesis in revenue terms. "Moving the review summary above the fold will increase RPV by reducing hesitation before add-to-cart" is testable. "Moving reviews will improve the page" is not.
- Set RPV as the primary metric, with conversion rate and AOV as supporting metrics that explain why RPV moved.
- Calculate sample size before launch, accounting for your page's existing traffic and baseline RPV variance, so you don't call a result early on noise.
- Track downstream effects for at least one full return-window cycle: refund rate, return rate, and any shift in repeat-purchase behavior the change might have triggered.
- Watch for guardrail violations, like a spike in support tickets or cart abandonment, that would offset any revenue gain the test appears to show.
Three pitfalls quietly invalidate more product page tests than any statistical error does. Segmentation leakage happens when a test group accidentally includes traffic from a different channel with different intent, skewing results. Promo overlap happens when a sitewide discount runs during the test window, making both variants look artificially strong. Currency issues happen when international traffic reports revenue in mismatched currency codes, a problem GA4's ecommerce guidance flags as one of the most common causes of corrupted experiment data.
Where Should You Start This Week?
Not every fix deserves the same urgency. Some take an afternoon; others take a quarter. Sorting them by effort and expected revenue impact keeps a roadmap honest.
Immediate checks, doable today with no development work: confirm price and availability are visible without scrolling, confirm the add-to-cart button gives clear visual feedback on click, and confirm every product has at least the minimum required images.
- Audit your top 20 pages by traffic for missing zoom functionality.
- Verify currency and item array parameters fire correctly on the purchase event.
- Check that review counts display next to star ratings on every page.
TimeframeActionExpected impactImmediateFix add-to-cart feedback and price visibilityReduces abandoned or duplicate cartsShort-termAdd review summaries and price-per-unit labelsLifts RPV on high-consideration pages90 daysRe-instrument analytics, run prioritized A/B testsConfirms revenue impact before scaling changes
Short-term projects, one to two sprints: build review summaries with source links, add price-per-unit labels near the buy control, and produce product video for anything with a fit or assembly question. The 90-day horizon is where the real structural work happens: re-instrumenting analytics so revenue attribution is trustworthy, running the prioritized A/B tests this roadmap identified, and clearing the technical performance backlog Baymard's benchmarking tends to expose.
Why Revenue-First Analytics Change the Prioritization Conversation
Most analytics platforms tell you what happened. Fewer tell you what it was worth. Cromojo was built around that distinction, tying revenue directly to the page, keyword, and channel that produced it, rather than stopping at traffic and conversion counts.
For a team running the playbook above, a few capabilities matter most:
- Direct Stripe and Shopify integration pulls revenue straight from the payment processor, which sidesteps a lot of the event-tracking fragility covered in the analytics section.
- Cookieless tracking means revenue attribution keeps working as third-party cookie restrictions tighten across browsers.
- Automated indexing and site monitoring catch technical issues, like a broken product page returning errors, before they quietly erase a page's RPV.
- Same-day revenue visibility means a pricing or media change's impact shows up in the dashboard fast enough to act on, rather than waiting for a month-end report.
Those capabilities feed directly into the RPV dashboards and experiment tracking this article recommends building, which is precisely why Cromojo's revenue analytics exists as a category rather than a feature bolted onto a traffic tool.
What Does a Realistic Optimization Timeline Look Like?
Product page revenue work rarely produces a single dramatic spike. It compounds across a handful of overlapping phases, each with a different expected payoff.
Weeks 1 to 2: Instrumentation and diagnosis. Fix GA4 event hygiene, confirm RPV is measuring correctly by page, and identify the two or three pages with the biggest gap between traffic and revenue. No design changes yet, just accurate measurement.
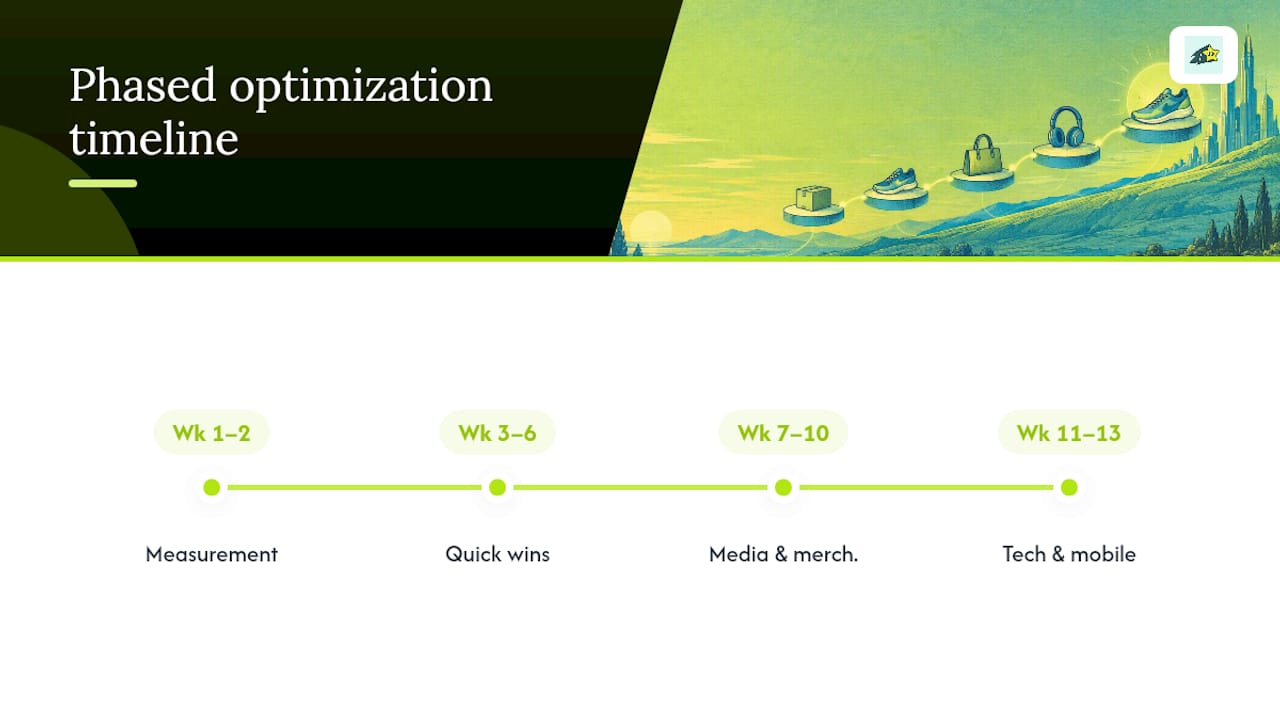
Weeks 3 to 6: Quick wins. Add-to-cart feedback, price-per-unit labels, and review summary placement usually ship in this window. Expect measurable but modest RPV movement, often in the single-digit percentage range on the pages touched, since these are friction removers rather than demand generators.
Weeks 7 to 10: Media and merchandising. Product video production, expanded photography, and bundle or cross-sell testing take longer to build but tend to produce the larger AOV and RPV gains, because they influence how much a buyer spends, not just whether they buy.
Weeks 11 to 13: Technical and mobile performance. Image optimization, critical CSS, and server response fixes close out the quarter. These often show up less as a revenue spike and more as a floor raised under every page at once, since slow load times quietly tax every product regardless of how well it's merchandised.
Running phases in this order matters. Fixing measurement before touching design prevents a team from crediting a UX change for revenue that was actually a tracking bug, and it keeps the 90-day plan honest about what actually moved the number.
What Does It Cost to Actually Do This Work?
Budget conversations around product page revenue tend to undercount two categories: content production and testing infrastructure. Technology costs are usually the most predictable line item. An analytics platform with revenue attribution built in runs $19 to $299 per month depending on traffic volume and team size, which is modest against even a single missed pricing insight on a high-traffic page.
Content creation is where costs vary the most. Professional product photography with zoom-ready resolution typically runs into several hundred dollars per SKU when outsourced, and product video costs more, often requiring a studio day or a freelance videographer per product line. Teams handling this in-house absorb the cost as staff time instead, which is real but easy to undercount in a budget spreadsheet.
Testing has its own cost structure separate from the tool itself. A/B testing platforms range from bundled features inside existing ecommerce software to dedicated experimentation tools priced by monthly tested traffic. The bigger hidden cost is analyst time: someone has to design the hypothesis correctly, calculate sample size, and interpret results without falling into the segmentation or promo-overlap traps covered earlier.
For teams that would rather hand implementation to specialists, Cromojo's conversion optimization services start at $3,800 per month, packaging the analytics, design, and testing work into a single engagement rather than three separate vendor relationships. Whichever route a team chooses, the honest budget line is: measurement is cheap, content and testing discipline are where the real spend lives.
Where Ecommerce Teams Waste Effort on Product Pages
The most common mistake is optimizing conversion rate in isolation, chasing a percentage that looks good in a slide deck while ignoring what that percentage is actually worth in dollars. A conversion lift on a low-margin, low-price page can matter less than a small RPV gain on a page nobody's paying attention to because its conversion rate looks unremarkable.
I've seen roadmaps get reordered the moment RPV entered the conversation. A "high-priority" redesign aimed at a page with strong traffic and decent conversion got quietly deprioritized once the margin-adjusted revenue showed it was one of the lowest earners per visitor in the catalog. A neglected accessory page, converting at a fraction of the rate, turned out to be worth more per visit once refunds were factored in.
Traffic and conversion rate are useful diagnostics, not verdicts. Validate every roadmap decision against revenue-attributed data before committing engineering time to it.
A Faster Way to See Which Product Pages Actually Pay Off
Cromojo is the analytics layer built for exactly the prioritization problem this article walks through: mapping real revenue, not just clicks, back to the specific page, keyword, or channel that produced it. By integrating with payment processors like Stripe and Shopify, revenue can be attributed to the right product page more reliably, and cookieless tracking helps maintain attribution as browser privacy rules tighten.
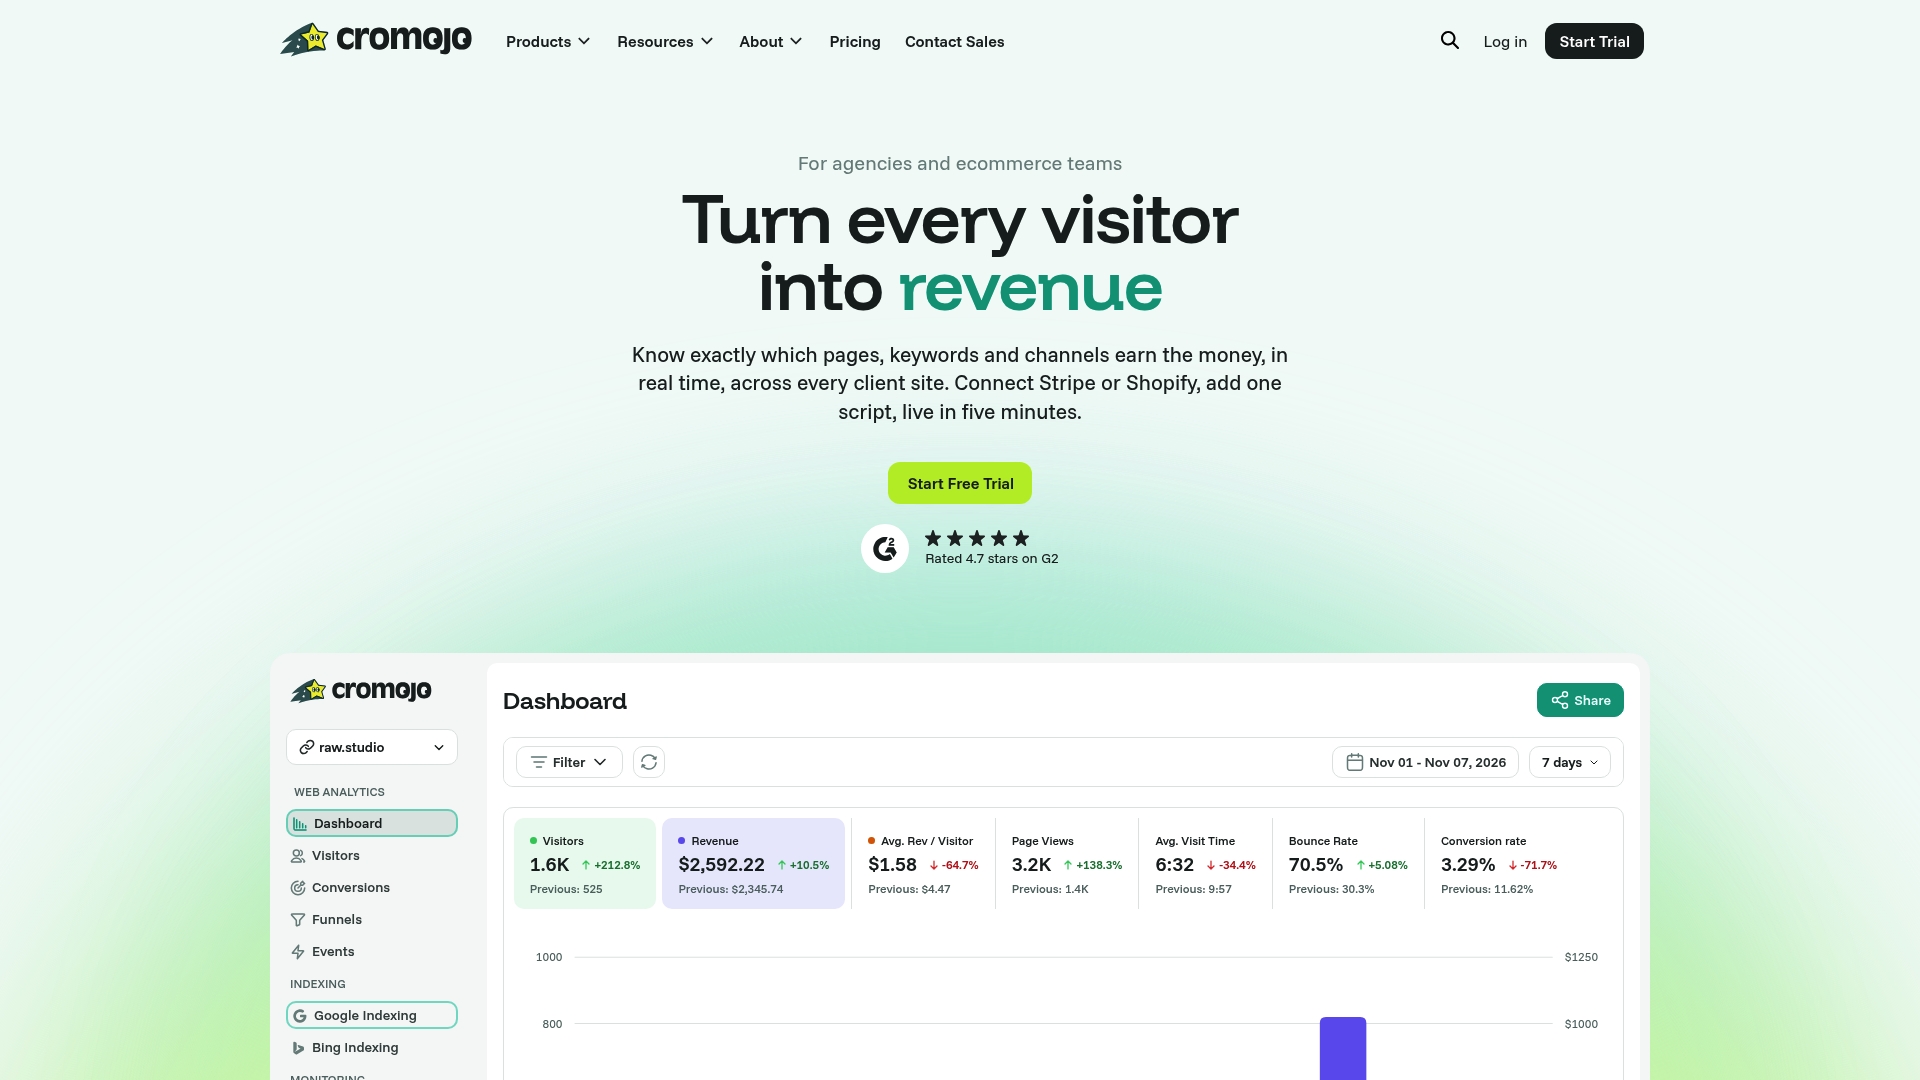
For a team ready to stop guessing which product page redesign deserves the next sprint, Cromojo's revenue analytics shows RPV by page alongside conversion funnels and visitor journeys, so the ranked dashboard from earlier in this article isn't a manual spreadsheet exercise. Plans start at $19 per month on the pricing page, with a free plan available for teams that want to see revenue-by-page reporting before committing to a paid tier. Start a trial and check which of your product pages are actually earning their traffic.