

An ecommerce conversion funnel maps every measurable action a shopper takes, from discovery to repeat purchase, and ties each step to a stage-specific KPI. Once you have that map, the highest-leverage move is almost never a full site redesign. It's finding the single leakiest stage and fixing it. Targeted fixes to one weak stage typically produce 20 to 40% relative lifts, and checkout-specific improvements alone have pushed conversions up substantially on large sites.
Here's the short version you can act on today:
- Map 4 to 6 funnel steps, from landing page to repeat purchase.
- Instrument event-level KPIs at each step, not just a top-line conversion rate.
- Segment by device and traffic source before you draw any conclusions.
- Watch session replays for the step with the biggest drop-off.
- Run one focused A/B test on that step before touching anything else.
Pro Tip: Resist the urge to fix five things at once. A funnel with one clear leak and one clean test tells you far more than a redesign that changes everything and explains nothing.
Key Takeaways
Fixing the single leakiest stage of an ecommerce conversion funnel, rather than redesigning the whole site, is the fastest route to a measurable revenue gain.
What Is an Ecommerce Conversion Funnel?
An ecommerce conversion funnel is an event-driven system that tracks shopper behavior across five connected moments: product view, add to cart, checkout initiation, purchase, and post-purchase action. It is not a static diagram of pages. It's a behavioral record. Treat it as event-level data rather than a fixed assumption about how people move through your site, because real shoppers loop, backtrack, and compare tabs before they buy.
The reason this matters for revenue is simple: a single blended conversion rate hides where the money is actually being lost. A site converting at 2% overall might be converting desktop visitors at 4% and mobile visitors at under 1%, a gap that never shows up until you split the data.
A few terms get used interchangeably, and the distinction is worth keeping straight:
- Marketing funnel describes how prospects become aware of a brand, largely outside your site.
- Sales funnel usually refers to a sales team's pipeline stages, more common in B2B.
- Ecommerce funnel is the on-site behavioral sequence from arrival to purchase and beyond, the one you can instrument and test directly.
Shoppers rarely move through it in a straight line. That's fine. The funnel still works as an analysis tool because it forces you to measure transitions between defined states instead of guessing at intent.
What Are the Stages of an Ecommerce Funnel?
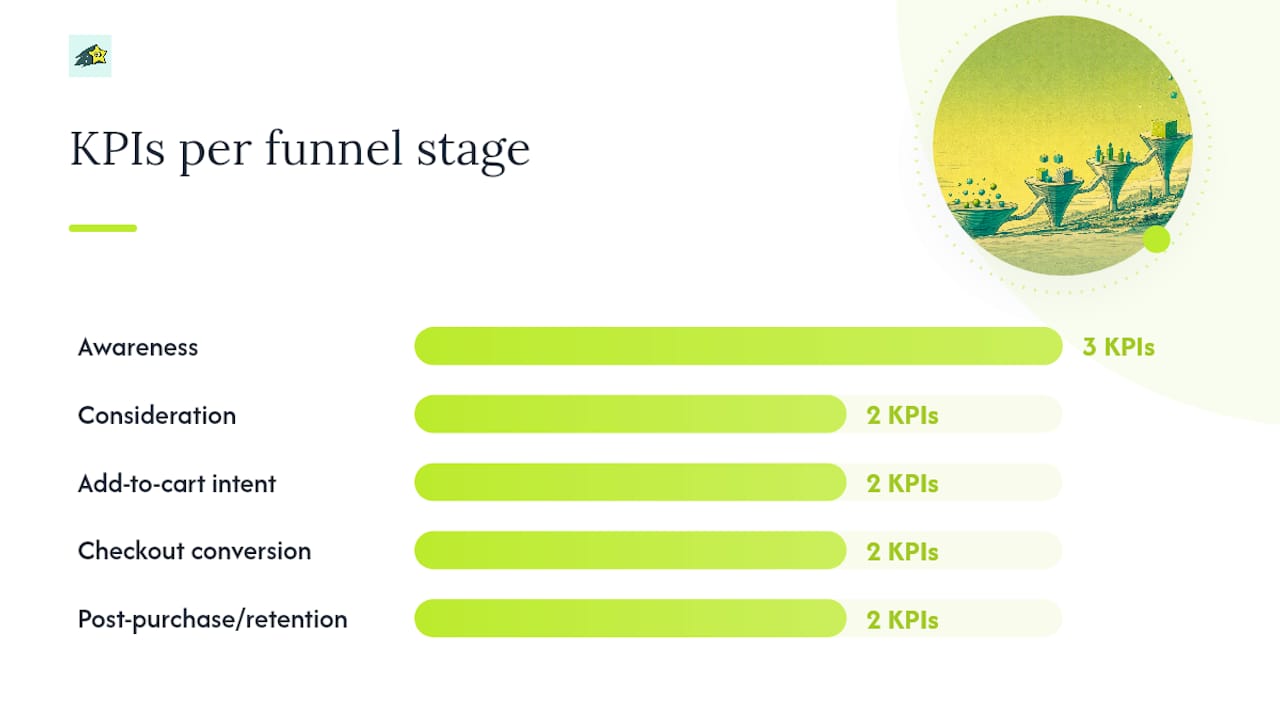
Most high-performing ecommerce teams work from five stages: awareness, consideration, add-to-cart intent, checkout conversion, and post-purchase retention. This lines up closely with how Shopify frames the ecommerce sales funnel, and it maps cleanly onto the pages your team already owns.
Awareness. The shopper lands on your site, usually through search, a social link, or an ad. The goal here is simply earning attention long enough to trigger a click deeper into the site. Track sessions, click-through rate from ads or search results, and homepage or landing page bounce rate.
Consideration. The shopper browses categories and product pages, comparing options. Your goal is helping them find a product that fits, fast. Watch product page views per session, category-to-product click rate, and time on product detail pages.
Add-to-cart intent. The shopper has picked something and signals real interest by adding it to a cart. This is where desire turns into a measurable commitment. Track product-view-to-add-to-cart rate and cart abandonment rate.
Checkout conversion. The shopper attempts to complete payment. This stage carries the most friction and the most fixable revenue loss. Track cart-to-checkout rate, checkout completion rate, and average order value (AOV).
Post-purchase and retention. The order is placed, but the funnel isn't over. Track repeat purchase rate, time between orders, and customer lifetime value (LTV).
The pattern in these numbers usually tells you exactly where to look. High product views paired with a low add-to-cart rate points at the product page itself: unclear pricing, weak images, missing reviews. A healthy add-to-cart rate paired with a weak checkout completion rate points somewhere else entirely: surprise shipping costs, a clunky form, or too few payment options. Same overall conversion rate, completely different fix.
How Do You Track an Ecommerce Conversion Funnel?
Three complementary approaches cover most of what you need: KPI-based measurement, campaign-based measurement, and attribution or journey-based measurement. Used together, they answer three different questions: how is each stage performing, which campaigns are driving traffic into the funnel, and which touchpoints actually deserve credit for a sale.
KPI-based measurement tracks stage-specific numbers on their own terms: product-view-to-cart rate, cart-to-checkout rate, checkout completion, AOV, and LTV. This is the backbone of ongoing funnel health.
Campaign-based measurement maps UTM parameters and channel data to funnel entry points, so you know whether a paid social campaign is feeding shoppers who convert or shoppers who bounce at the product page.
Attribution and journey-based measurement looks across multiple touchpoints rather than crediting the last click. A shopper might discover you through an Instagram ad, come back through organic search two days later, and finally convert through email. Last-click attribution hands all the credit to email and none to the ad that started things. Multi-touch and time-decay models distribute credit more realistically across the path.
A clean instrumentation setup makes all three possible. Build it in this order:
- Define consistent event names across every page (add_to_cart, begin_checkout, purchase) so data doesn't fragment across naming variants.
- Use a persistent visitor identifier that survives across sessions and devices where possible.
- Confirm revenue events are captured server-side, not just client-side, so ad blockers and script failures don't silently erase real sales.
- Map every acquisition channel with UTM parameters before launching a campaign, not after.
- Run a data quality check monthly, comparing funnel totals against actual order counts in your payment processor.
Segmentation has to happen before you act on anything. Split every funnel report by device, traffic source, and new versus returning visitors, because aggregated data routinely hides gaps as large as 8% desktop conversion against 1% mobile conversion on the same site. A tool like Cromojo's analytics dashboard can automate this segmentation so it happens by default rather than as an afterthought.
How Do You Diagnose Funnel Drop-Offs?
Diagnosing a leak means moving from "conversion dropped" to a specific, testable hypothesis, and that takes a defined sequence rather than a hunch.
- Confirm the data first. Rule out tracking bugs, a broken event, or a tagging error before assuming the drop is real.
- Segment the funnel. Break the drop down by device, channel, and visitor type to see if it's universal or isolated to one segment.
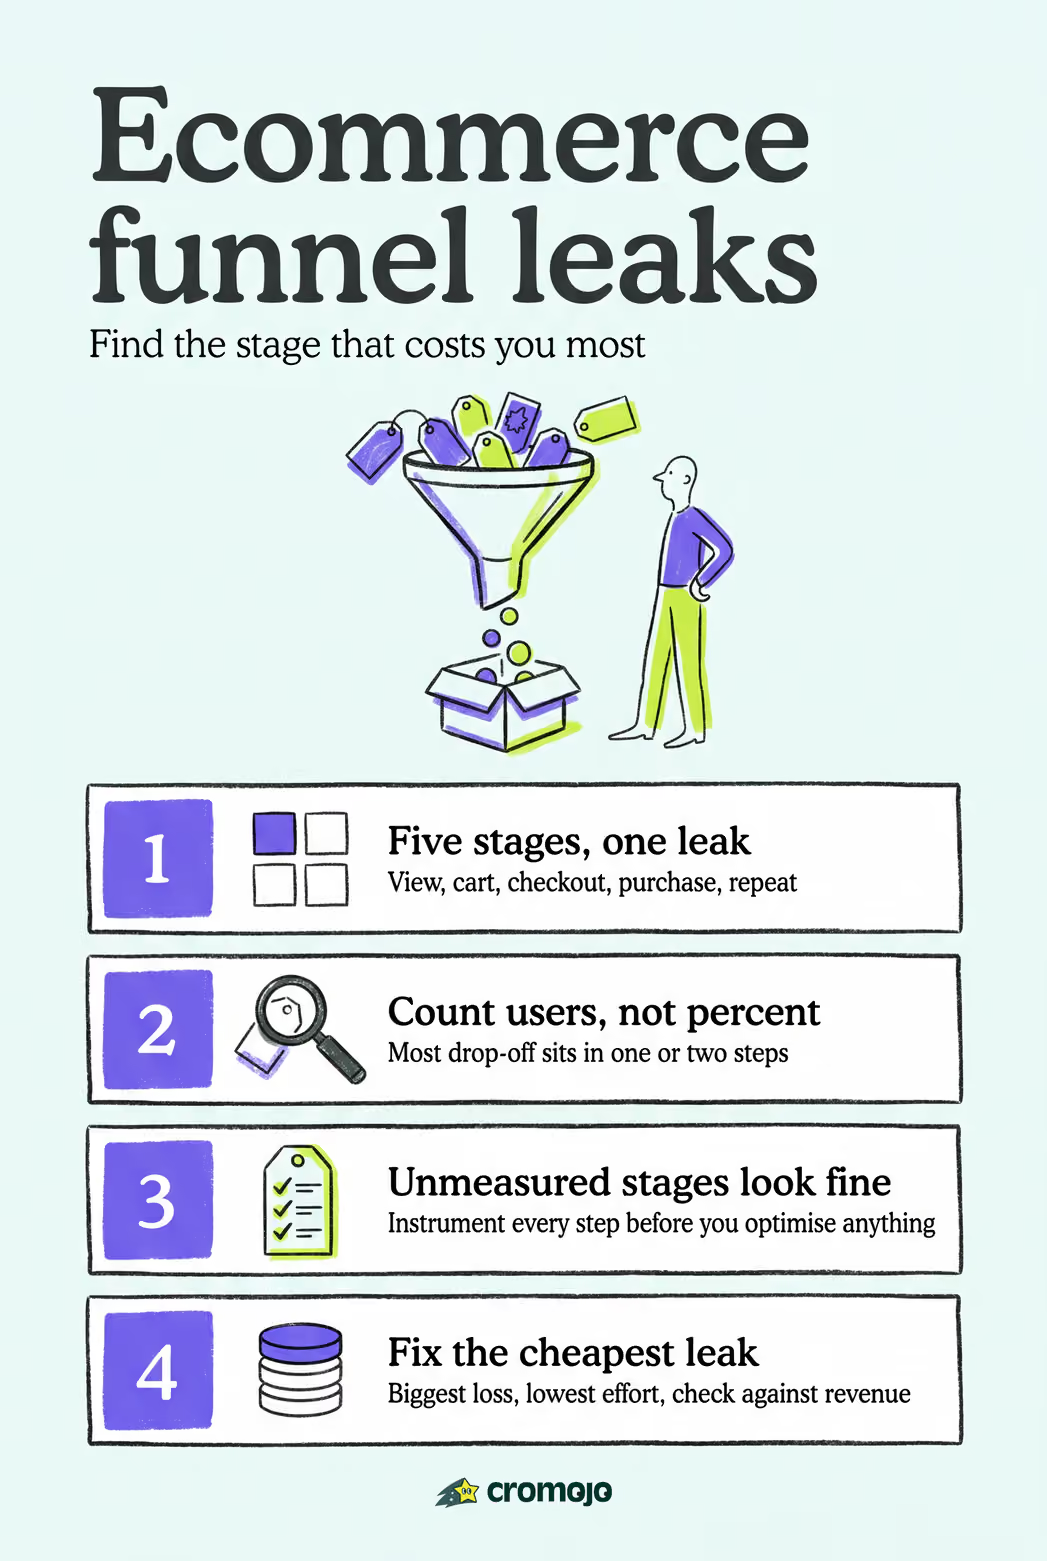
- Prioritize by absolute users lost, not percentage. A 5% drop affecting 50,000 sessions matters more than a 20% drop affecting 500.
- Watch session replays and heatmaps for the exact step where users hesitate, rage-click, or abandon. Pairing quantitative funnel data with qualitative session replay is what turns a number into an explanation.
- Collect targeted user feedback, a short exit survey or on-page prompt asking what stopped them.
- Form a specific, testable hypothesis before writing a single line of new code.
A dedicated post on what monitoring data reveals about conversion drop-off is worth reading if a drop coincides with a deploy or a traffic spike, since technical errors often masquerade as UX problems.
Prioritize by impact times ease. The step that loses the most users and costs the least to fix should always jump the queue ahead of a bigger, riskier redesign.

Pro Tip: Most funnels concentrate 60 to 80% of their drop-off in one or two steps. Stop spreading investigation time evenly across the whole funnel and put almost all of it there instead.
That concentration is exactly why the fix rarely needs to be dramatic. Targeted fixes to the leakiest stage typically produce 20 to 40% relative lifts, without touching the rest of the site, and large-site checkout fixes alone have driven gains above 35%.
What Testing and Optimization Tactics Work at Each Stage?
Once you have a hypothesis, the test itself should match the stage where the leak lives.
- Awareness: test ad creative and CTA wording against each other, and check whether landing page headlines match the ad copy that brought the visitor there.
- Product page: test image and video quality, review placement, and how price is presented (bundled savings versus a bare number).
- Cart: test shipping cost messaging, urgency cues like low-stock indicators, and cross-sell placement.
- Checkout: test guest checkout availability, the number of payment options, and form length. Unexpected costs revealed late in checkout are one of the most common killers at this stage.
- Post-purchase: test onboarding emails, replenishment reminders, and how soon a second-purchase offer appears after delivery.
A solid A/B test needs the same five elements every time, regardless of which stage you're testing:
- A specific hypothesis tied to the diagnosed leak, not a general "let's see what happens."
- A primary metric (the stage KPI you're trying to move) and a secondary metric (checking you didn't break something downstream).
- A rough sample size estimate so you know how long the test needs to run before results mean anything.
- A fixed run-length rule, decided in advance, so you're not tempted to stop early the moment results look good.
- A rollback plan if the variant underperforms, and a way to translate any lift into estimated revenue impact.
How Should You Report Funnel Performance and Attribution?
A funnel dashboard should answer three questions at a glance: where are people dropping off, which segments are worst affected, and how much revenue is on the line. Build it around these elements:
- A stage-by-stage funnel chart showing conversion rate between each step.
- Absolute users lost per stage, not just the percentage drop.
- Top segments by drop-off (device, channel, new versus returning).
- Time-in-funnel, since a slow checkout process often correlates with abandonment.
- Revenue per cohort, tracked over weeks, not just a single conversion snapshot.
- An experiment results panel tied to incremental revenue, not just conversion rate lift.
On attribution, last-click models are simple but often wrong. Multi-touch and time-decay models give earlier touchpoints partial credit, which matters if you're deciding where to put next quarter's ad budget. Revenue attribution by keyword, page, or channel is the piece most dashboards skip, and it's the piece that tells you which marketing spend is actually producing sales rather than just traffic.
Always report absolute lost users alongside percentages, since a 5% relative drop on your highest-traffic page can dwarf a 30% drop on a low-traffic one. And when you claim a test won, show the confidence level, not just the headline lift.
What's a Realistic 30/60/90-Day Funnel Improvement Plan?
You don't need a quarter-long project to see real movement. A tight, sequenced plan gets you there faster than an open-ended overhaul.
Days 1 to 30:
- Map your funnel into 4 to 6 concrete steps and confirm each has a matching tracked event.
- Fix any instrumentation gaps, missing events, broken tags, inconsistent naming.
- Segment the funnel by device and channel to find the single leakiest step.
- Watch 10 to 20 session replays of users who dropped at that step.
Days 31 to 60:
- Run 1 to 3 focused A/B tests directly targeting the leak you identified.
- Ship the quick UX fixes the replays surfaced, without waiting for the tests to finish where the fix is obvious.
- Measure lift against your primary KPI and translate it into estimated revenue.
Days 61 to 90:
- Roll the winning fixes out site-wide, not just on the test segment.
- Build the funnel dashboard into a recurring weekly or monthly review.
- Start a second round of tests focused on retention and repeat purchase.
What Do Analytics Teams Get Wrong About Funnel Optimization?
The most common mistake teams make isn't a bad hypothesis. It's skipping the diagnosis entirely and jumping straight to a redesign. Diagnose before you rebuild, segment before you fix anything, and measure incremental revenue after every test, not just conversion rate. A test that lifts conversion 3% but drags down AOV isn't actually a win.
One thing worth stealing from experienced analytics teams: treat post-purchase as part of the funnel, not an afterthought. Instrument repeat-purchase signals the same way you instrument checkout completion. Pro Tip: If you're only measuring up to the "thank you" page, you're managing half a funnel and calling it the whole thing.
Cromojo's approach reflects this bias toward diagnosis over redecoration: surfacing which pages, keywords, and channels actually generate revenue, rather than stopping at a generic conversion percentage.
See Where Your Funnel Is Actually Losing Revenue
Most of what slows teams down isn't a lack of ideas for fixes. It's not knowing which stage is actually bleeding revenue before they start testing. Cromojo ties funnel stages directly to dollars: real-time revenue attribution by keyword, page, and channel, conversion funnels built for ecommerce behavior, visitor journey analysis, and site monitoring that catches technical drop-offs before they show up as a mystery dip in your reports.
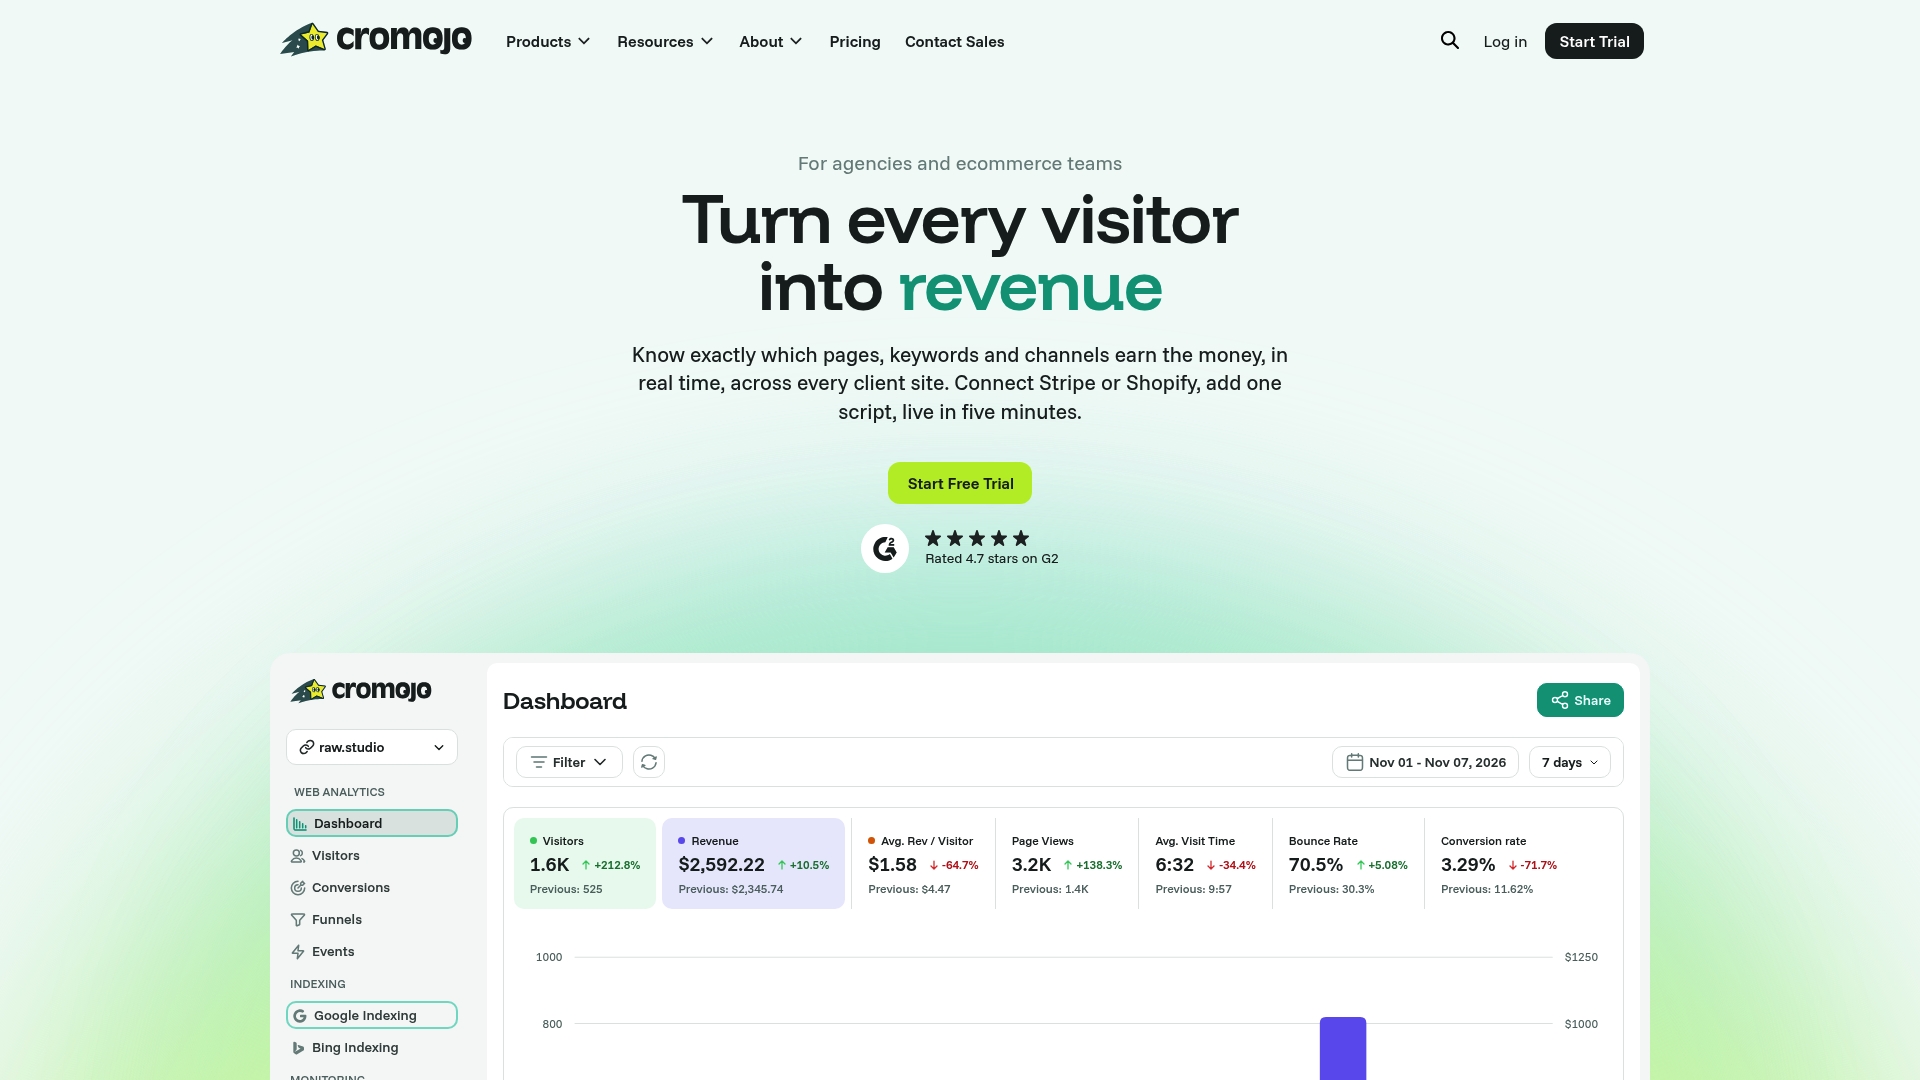
If checkout completion or add-to-cart rate has been flat for months and you're not sure why, Cromojo's revenue analytics shows exactly which pages and channels are converting and which are quietly draining budget. Teams weighing it against simpler tracking setups can see the comparison against basic analytics tools directly. Start a free trial and connect your Stripe or Shopify data to see your funnel's actual revenue picture within minutes.