


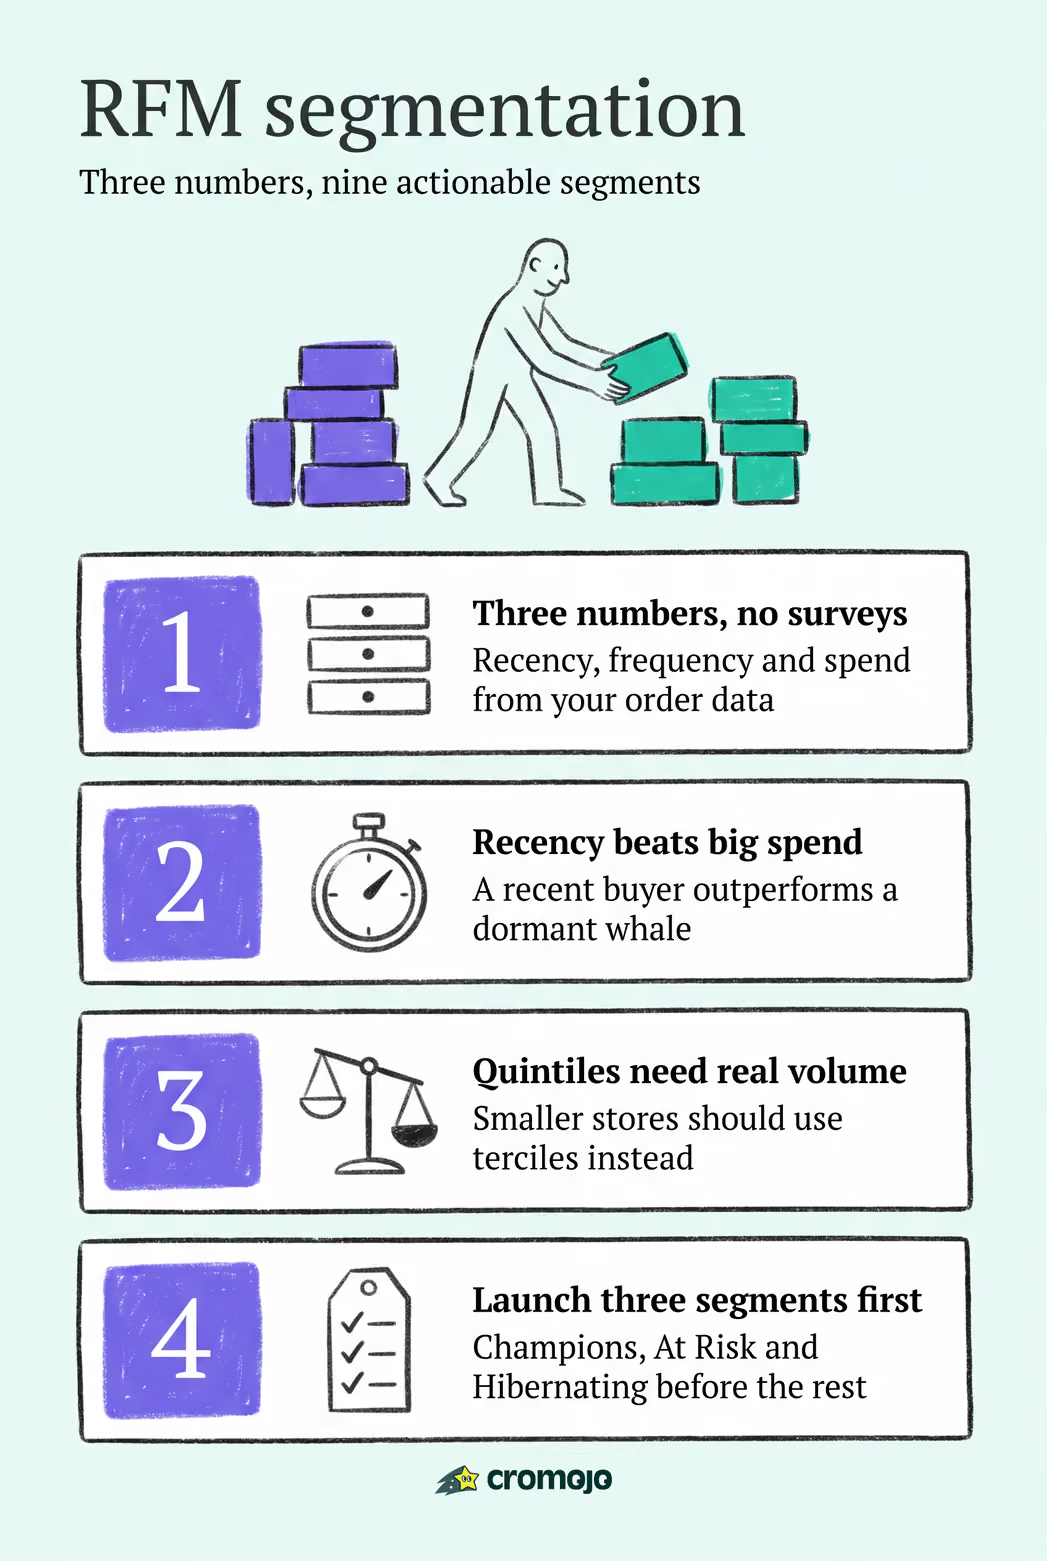
RFM segmentation ranks your customers by three numbers: how recently they bought (Recency), how often they buy (Frequency), and how much they spend (Monetary). If you run an ecommerce store, this is the fastest high-ROI segmentation method you can put into production, and you don't need a data science team to do it.
Here's the operational path: score every customer into quintiles on each dimension, then act on three segments first: Champions, At Risk, and Hibernating. You can measure revenue lift within two billing cycles of launching your first campaigns.
- Define R, F, and M for your last 12 months of orders.
- Rank customers 1 to 5 on each dimension (quintile scoring).
- Combine the three scores into a segment label like "Champion" or "At Risk."
- Launch targeted campaigns for your top three priority segments first.
Pro Tip: Before you build anything, export four fields: customer_id, last_order_date, order_count, and total_spend for a rolling 12-month window.
Key Takeaways
RFM segmentation works because it turns three simple order-data signals into prioritized, campaign-ready customer groups without requiring surveys or third-party data.
What Is RFM Segmentation and Why Does It Work for Ecommerce?
RFM stands for Recency, Frequency, Monetary, three behavioral signals pulled straight from your order history. Recency measures days since a customer's last order. Frequency counts distinct transactions in your lookback window. Monetary totals what they've spent, often adjusted to average order value so a single mega-purchase doesn't distort the picture. Retail and catalog companies have used this framework for decades because it requires no surveys, no third-party data, and no cookies. It only needs the order data you already store.
Recency tends to be the strongest predictor of the three. A customer who bought two weeks ago is statistically far more likely to buy again soon than one who bought eight months ago, even if the eight-month customer has a higher lifetime spend. That's counterintuitive to marketers who default to targeting your biggest spenders, but ordering behavior decays. A dormant big spender is often harder to reactivate than a moderate spender who just converted.
RFM analysis for online stores works especially well when:
- You sell repeat-purchase products (consumables, apparel, beauty, food).
- You have at least a year of clean order history.
- Your marketing team wants segments they can act on this week, not next quarter.
Where RFM alone starts to strain is subscription businesses, where churn and billing cycles matter more than discretionary reorder timing, and multi-vendor marketplaces, where a single "customer" might behave completely differently across categories. In those cases, RFM still gives you a solid baseline, but you'll want to layer in cohort-based retention analysis or category-level scoring to catch what raw RFM misses. For most small and mid-sized ecommerce operations, though, three numbers per customer is enough to build a genuinely effective customer segmentation ecommerce program without hiring a statistician.
How Do You Calculate R, F, and M Scores?
Scoring RFM is mechanical once you set up the pipeline correctly. Here's the sequence.
- Pull clean order data. Exclude fully refunded orders, but keep partially refunded ones at their net value. Count distinct transactions, not line items, for Frequency.
- Set your lookback window. A 12-month window is a sensible default for most ecommerce categories, according to practical implementation guides. Extend to 24 months if you sell seasonal or high-ticket items where purchase cycles naturally run longer.
- Calculate the three raw metrics per customer: days since last order (Recency), order count in the window (Frequency), and total net spend (Monetary).
- Rank into quintiles using NTILE(5). This SQL window function splits your customer base into five equal-sized buckets per metric. Recency needs to be inverted, since a lower "days since last order" number should map to a higher score (5 is best, 1 is worst). Frequency and Monetary sort normally, high to low.
- Concatenate the three scores into a code, like 545 or 213. This produces up to 125 unique combinations, a structure documented in the standard RFM model.
- Collapse the 125 combinations into 8 to 11 named segments so your team can actually act on them instead of staring at raw codes.
Here's a worked example. Say a customer last ordered 9 days ago, has placed 6 orders in the past year, and spent $840 total. Against your full customer base, that recency lands her in the top quintile (score 5), her frequency in quintile 4, and her spend in quintile 4. Her code is 544, close enough to your top-tier "Champion" bucket to prioritize her for a loyalty offer rather than a discount blast.
Smaller stores run into a real problem here: quintiles need volume to mean anything statistically. If you have a smaller customer base, using quintiles per dimension can produce uneven groups. Using fewer buckets, such as quartiles or terciles, may be more appropriate until your customer count increases. The scoring logic doesn't change, only the bucket count.
Pro Tip: Don't build your first RFM model in a live production table. Run it in a spreadsheet or a staging table first, spot-check ten customers by hand against their actual order history, and confirm the codes make intuitive sense before you wire it into campaigns.
One data quality note that trips up more teams than anything else: guest checkouts and multi-currency orders. If a customer checks out as a guest three times with three different email addresses, your Frequency score silently underestimates them. And if you sell in multiple currencies without normalizing to a single reporting currency, your Monetary quintiles will skew toward whichever currency happens to have the highest face-value numbers. Fix both before you trust a single score.
What Are the Common RFM Segments and Marketing Actions?
Once you've got three-digit codes, the real work starts: translating numbers into named groups your marketing team can build campaigns around. Most ecommerce RFM models converge on a similar set of buckets, a pattern Shopify's own RFM segmentation guide documents in detail.
- Champions (high R, F, M): Your best, most recent, most frequent, highest-spending customers. Objective: retain and reward. Channel: email and SMS. Hook: early access to new products, loyalty tier upgrades. KPI: repeat purchase rate.
- Loyal Customers (high F, moderate R/M): Buy often but aren't necessarily your top spenders. Objective: increase average order value. Channel: email with cross-sell bundles. KPI: AOV lift.
- Potential Loyalists (recent, moderate frequency): New-ish customers showing promise. Objective: convert to habitual buyers. Channel: onboarding email flow. KPI: second-purchase rate.
- New Customers (high R, low F): First-time buyers. Objective: nail the second purchase. Channel: post-purchase email sequence. KPI: 30-day repeat rate.
- Promising (recent but low spend): Browsers who converted cheaply. Objective: upsell. Channel: retargeting ads. KPI: order value on next purchase.
- Need Attention (declining R, decent F/M history): Used to be strong, slipping now. Objective: re-engage before they churn fully. Channel: personalized email, "we miss you" with a mild incentive. KPI: reactivation rate.
- At Risk (low R, high F/M historically): Valuable customers going quiet. Objective: win back with urgency. Channel: email plus paid social retargeting. KPI: response rate.
- Hibernating (very low R, moderate history): Long dormant, moderate past value. Objective: low-cost reactivation attempt. Channel: automated win-back email. KPI: reactivation rate at low spend.
- Lost (lowest R, F, M across the board): Objective: minimal spend, occasional broad promotional blast only. Channel: low-frequency email. KPI: unsubscribe rate (to keep your list clean).
If you're launching your first RFM program, don't try to activate all nine segments in week one. Prioritize in this order:
- Champions first, because retaining your best customers is cheaper than acquiring new ones and the campaign is simple: a thank-you offer or early access drop.
- At Risk second, because these customers already proved they'll spend with you, and a well-timed win-back campaign often converts faster than acquisition marketing.
- Hibernating third, using a low-cost automated flow, since even a small reactivation rate on a large dormant list adds up.
That three-segment launch plan gets you a working RFM segmentation ecommerce program in production without waiting on a full nine-segment campaign build.
How Do You Implement RFM Segmentation Step by Step?
You don't need a data warehouse to start. If your customer base is under a few thousand people, export your order history from Shopify or your email platform (Klaviyo and similar tools both support customer-level export), drop it into a spreadsheet, and use PERCENTILE or RANK functions to build your first quintiles manually. That one-day starter gets you a working model before you invest in anything automated.
For a scalable version, here's the operational sequence:
- Define your rolling window in a CTE. Set the lookback (12 months, or 24 for seasonal categories) at the top of your query so changing it later doesn't mean rewriting the whole script. This is standard practice in rolling-window SQL implementations for RFM scoring.
- Aggregate order data per customer inside that window: days since last order, count of distinct orders, sum of net spend.
- Apply NTILE(5) per dimension, inverting the recency sort order so recent buyers score highest.
- Concatenate the three scores into a segment code and map codes to named segments in a lookup table.
- Write results to a dedicated segments table, keyed by customer_id, with a timestamp for when the score was calculated.
- Schedule the job with cron (or your data platform's native scheduler) to rerun on your chosen cadence.
- Sync segment labels to your email platform or CDP via API or a scheduled export, so campaigns can target by segment without manual list-building.
Pro Tip: Resolve customer identity before you score anything. If a shopper checks out as a guest and later creates an account with a different email, your Frequency and Monetary numbers will both undercount them. A basic email-plus-phone match rule catches most of this.
Watch for four recurring pitfalls: refunded orders inflating Frequency if you don't exclude them, guest checkouts fragmenting a single customer into multiple records, multi-currency spend that needs normalizing to one reporting currency before you rank Monetary, and stale segment tables that never get rescheduled after the initial build. Each one quietly corrupts your scores without throwing an error, which is exactly why they're worth checking first.

How Often Should You Recalculate RFM Segments?
Recalculation cadence depends on how fast your customers naturally reorder. If you sell consumables with a two-to-four-week repurchase cycle, recalculate weekly. If your average reorder cycle stretches past 60 days (furniture, apparel by season, big-ticket electronics), monthly recalculation is usually sufficient and saves compute cost.
Sample size drives your bucket strategy. Quintiles need a reasonably large base to produce meaningful, evenly distributed groups; guidance from practitioners suggests you should have at least a few thousand customers before quintiles are stable, per Agile Commerce's segmentation guidance. Below that, switch to quartiles or terciles so each bucket still holds enough customers to be statistically meaningful.
Validate performance with these metrics tracked per segment, not just in aggregate:
Run A/B tests on your campaigns rather than assuming the segment alone drives results. Split your At Risk segment into a control group and a treatment group receiving your win-back offer, then compare repeat purchase rate between them over 30 to 60 days. It's the only way to know whether the RFM targeting or the offer itself is doing the work.
Pair RFM validation with retention cohort analysis. Cohort curves that flatten out over time signal a stable retained base; curves that keep decaying point to an onboarding or product-value problem RFM alone won't diagnose, a distinction Mixpanel's cohort analysis guide lays out clearly. RFM tells you who to target. Cohort analysis tells you whether your retention strategy is actually working over time. Wikipedia's overview of the RFM model also recommends checking new segments against a holdout set before rolling campaigns out broadly, since a small sample can produce a segment pattern that looks meaningful but is really just noise.
When Should You Extend RFM With Behavioral Data or Machine Learning?
Classic three-factor RFM is a strong baseline, but it has a ceiling. A 2026 study published in MDPI found that adding behavioral dimensions, specifically price sensitivity, shopping regularity, and basket depth, to an extended RFM framework produced measurable improvements in segmentation accuracy compared to standard three-factor scoring, evaluated using cluster-quality measures like the Silhouette and Davies-Bouldin indices.
Adding behavioral signals doesn't replace RFM. It sharpens the boundaries between segments that look similar on R, F, and M alone but behave very differently, one price-driven and deal-seeking, the other loyal regardless of discount.
Two hybrid approaches are worth knowing:
- RFM plus K-means clustering: Instead of fixed quintile cutoffs, let a clustering algorithm find natural groupings across your full feature set. This tends to pay off once you have enough customers and enough behavioral variables that manual bucket lines start feeling arbitrary.
- RFM plus a propensity model: Layer a predictive model trained to estimate purchase probability on top of your RFM scores. This works best when you have a large, labeled history of who did and didn't reorder after a given campaign.
A rough threshold for considering machine learning extensions: once your customer base crosses roughly 50,000, the added complexity of clustering or propensity modeling usually justifies itself. Below that, the marginal accuracy gain rarely outweighs the maintenance burden.
That maintenance burden is real. Machine learning layers introduce stale features (behavioral inputs that go out of date faster than raw R, F, M), data leakage risk if your training data accidentally includes information from after the prediction point, and a genuine loss of explainability. A marketing team can understand "this customer hasn't ordered in 90 days." Explaining a clustering algorithm's boundary decision to a campaign manager is a different conversation entirely.
Who's Behind This Playbook and How Does Cromojo Fit In?
RFM segmentation is a mechanical, order-data-driven method, but implementing it well requires understanding both the SQL mechanics and the ecommerce marketing motion around it, campaign sequencing, channel selection, and revenue attribution back to the segment that triggered a sale.
That last piece, tying segment-level campaigns back to actual revenue, is where most RFM programs fall apart. You can build a perfect segmentation model and still have no idea whether your Champions campaign generated $40,000 or $4,000, because your analytics stack doesn't connect email clicks to Stripe transactions.
This is where a revenue attribution platform earns its keep:
- Cromojo connects directly to Stripe and Shopify, so revenue generated by a segment-specific campaign shows up tied to the actual page, channel, and customer, not just an inflated click count.
- Cookieless tracking means you can measure campaign performance without the accuracy gaps that come from cookie consent drop-off, a growing issue in regions with strict privacy rules.
- Advanced segmentation inside the platform lets you build audience views that mirror your RFM buckets and watch revenue move in near real time as campaigns launch.
For teams tracking RFM segment performance alongside broader analytics work, that direct revenue-to-segment link closes the loop RFM alone can't close on its own.
What Actually Moves the Needle in RFM Programs
Most RFM content treats all nine or eleven segments as equally urgent, and that advice quietly kills momentum. Teams try to build campaigns for every bucket simultaneously, run out of bandwidth by week three, and the whole initiative stalls. The research and the math both point the same direction: Champions, At Risk, and Hibernating return revenue faster than the rest combined, because they require the least creative complexity and target customers who've already proven they'll transact with you.

The conventional wisdom also oversells machine learning too early. A 50-person DTC brand doesn't need K-means clustering. It needs clean order data, a 12-month lookback, and a working SQL query it can rerun monthly. Behavioral extensions and propensity models earn their complexity only once volume justifies it, and most stores never reach that threshold.
What gets underweighted almost everywhere: attribution. A segment strategy without revenue tracking is a guess dressed up as a strategy. If you can't see which segment-specific campaign generated which dollar, you're optimizing blind, no matter how clean your quintiles are.
Put RFM Segmentation to Work With Cromojo
Building the RFM model is the easy part. Proving it worked, tying a Champions campaign or a Hibernating win-back flow to actual dollars in Stripe or Shopify, is where most ecommerce teams lose the thread. Cromojo closes that gap by attributing real-time revenue directly to the pages, campaigns, and channels driving it, so you can see whether your At Risk win-back sequence generated $12,000 or barely moved the needle.
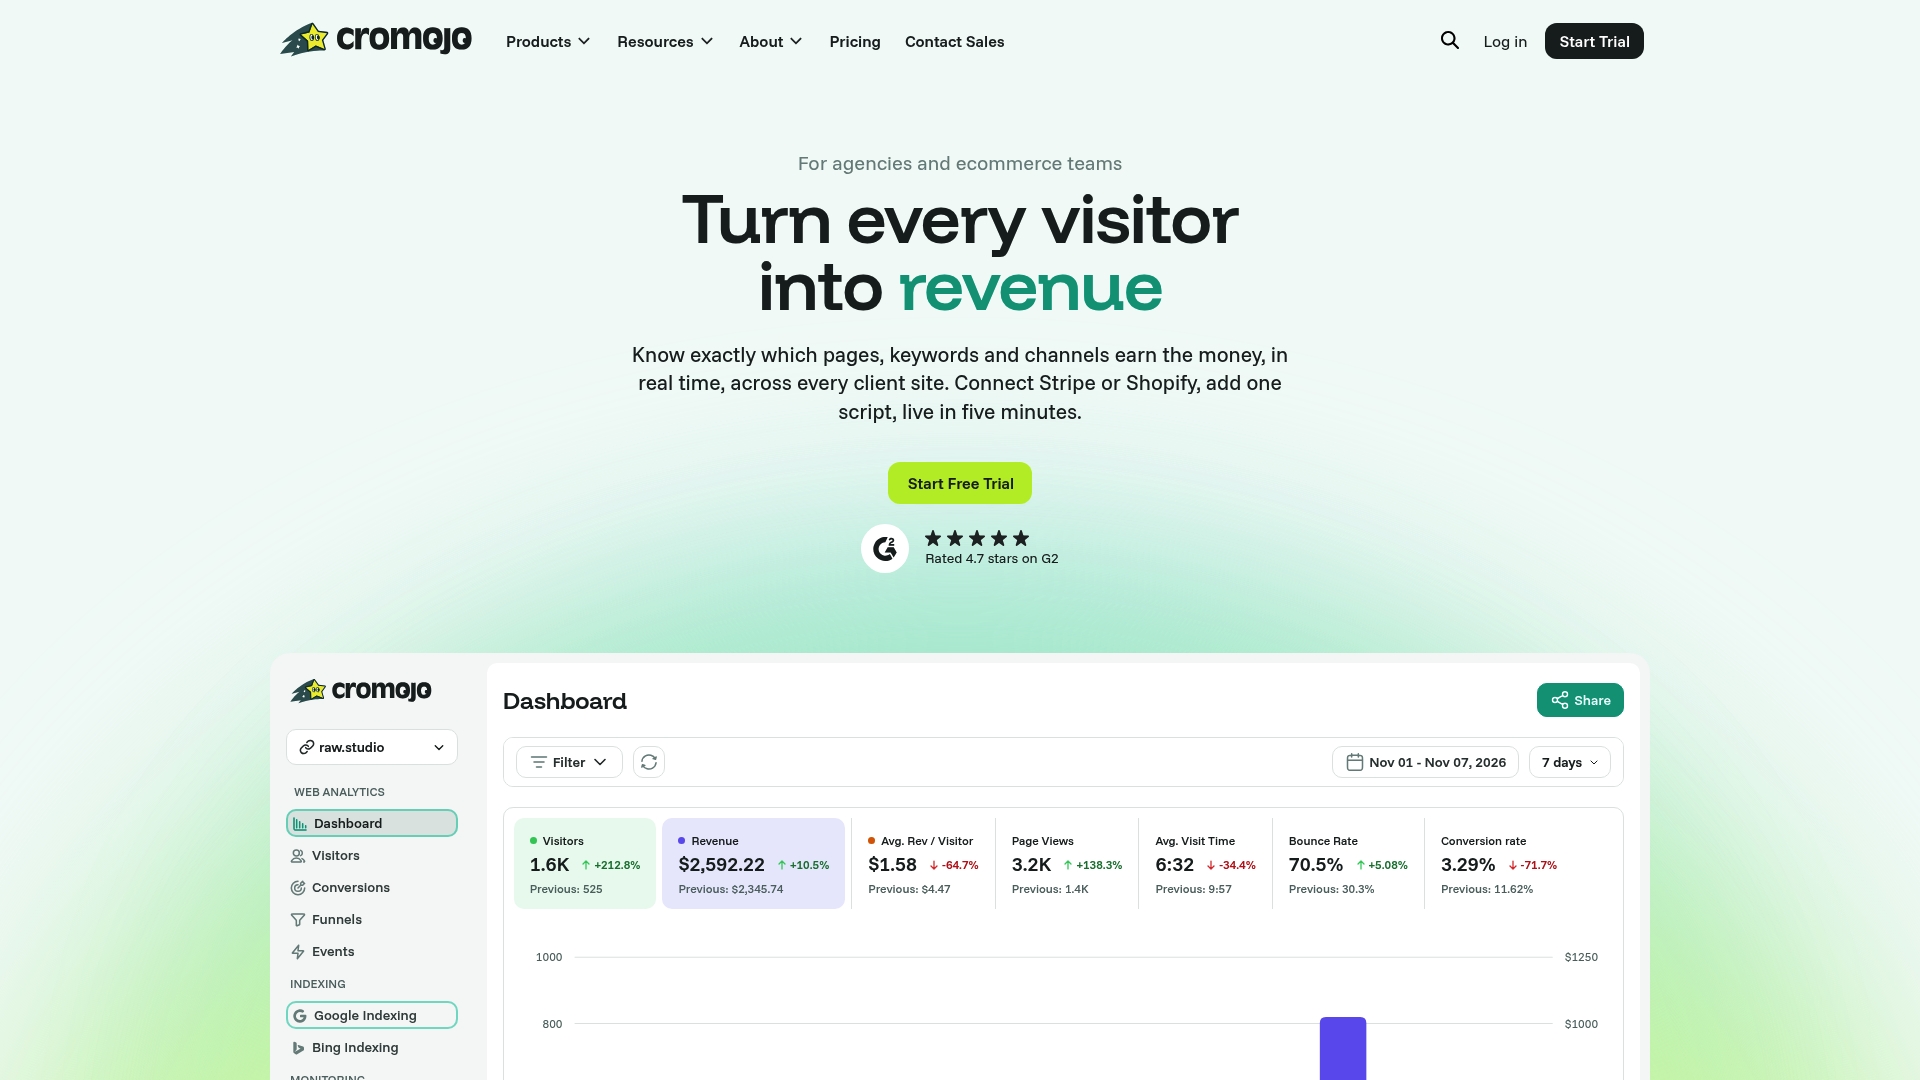
The platform's advanced segmentation tools let you build audience views that mirror your RFM buckets, and because tracking is cookieless, you get accurate campaign attribution even as privacy regulations tighten browser-based measurement elsewhere. Setup takes a lightweight script, no engineering sprint required, and it integrates with the Stripe and Shopify data you're already using to calculate R, F, and M scores in the first place. If you're ready to see actual revenue behind your segments instead of guessing, start a free trial and connect your store today.