
.png)
Website monitoring tools are widely used, but rarely understood.
Most teams install a tool, see a green status indicator, and assume everything is working as expected. That assumption shapes decisions, priorities, and confidence in performance. The issue is not the tool itself. The issue is the expectation behind it.
When you do not understand how monitoring tools actually work, you assume they are catching everything. In reality, they are only capturing a limited layer of activity.
This creates a dangerous gap.
You trust the data, but the data is incomplete.
This is how issues go unnoticed for long periods. And when they finally surface, the damage has already been done.
Research supports this behavior gap. Studies from the Nielsen Norman Group show that users often rely on system feedback as a primary indicator of performance. If a system signals that everything is fine, users rarely question it. The same principle applies to teams managing websites. If the dashboard looks healthy, deeper issues are often ignored.
The four core monitoring methods explained
To understand how website monitoring tools work, you need to look at the methods behind them. Each method observes your website from a different angle, and each one answers a different question.
Ping monitoring
Ping monitoring is the most basic layer.
It checks whether your server is reachable by sending a simple signal. If the server responds, the system assumes everything is operational.
This method is useful for detecting complete outages. However, it does not provide insight into what users actually experience.
A server can respond successfully while the website itself is broken.
HTTP checks
HTTP monitoring adds another layer.
Instead of simply checking if the server responds, it requests a specific page and evaluates the response. This includes status codes and basic response times.
This gives you more visibility than ping monitoring, but it still operates at a surface level.
It confirms that a page loads, but not whether it works as intended.
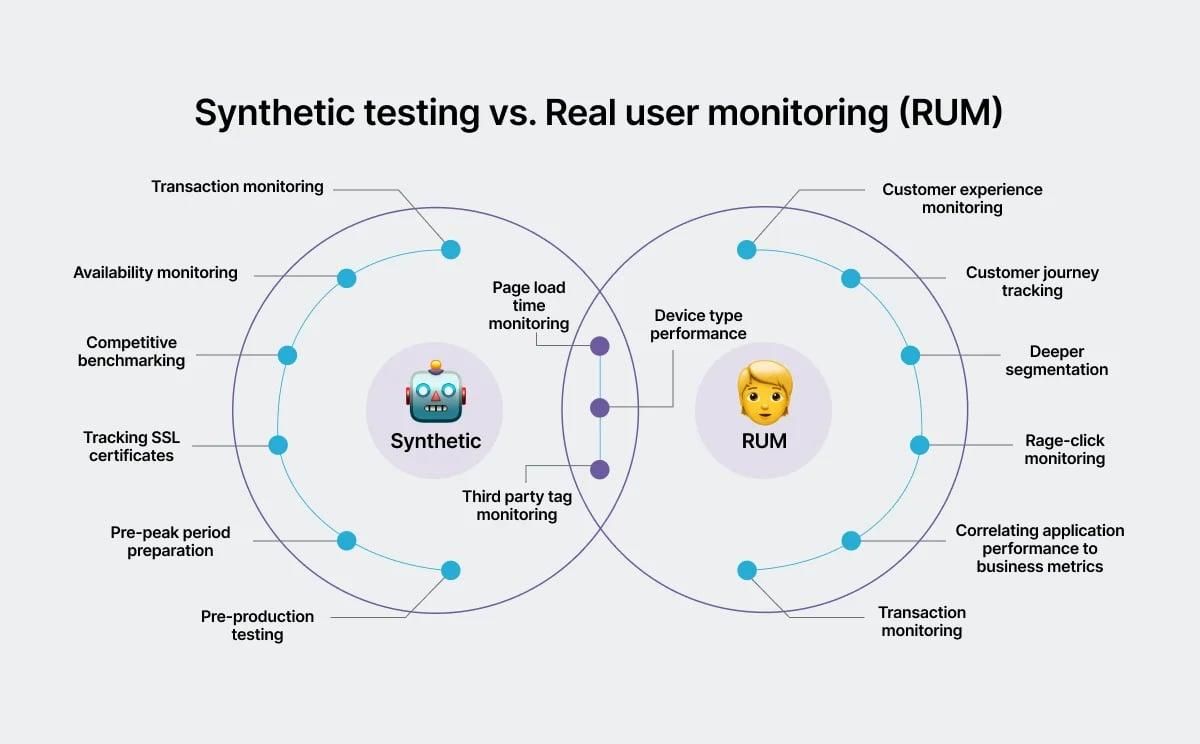
Synthetic monitoring
Synthetic monitoring simulates user behavior.
It allows you to test predefined flows such as logging in, searching, or completing a purchase. This makes it more useful for identifying issues in key user journeys.
Instead of asking if a page loads, it asks whether a user can complete a task.
This approach aligns with research in usability. According to Baymard Institute, usability issues in checkout flows are one of the leading causes of cart abandonment, which averages close to 70 percent across ecommerce sites. Synthetic monitoring helps detect these types of issues before they affect users at scale.
However, it is still limited by what you choose to test. If a problem occurs outside scripted flows, it may go unnoticed.
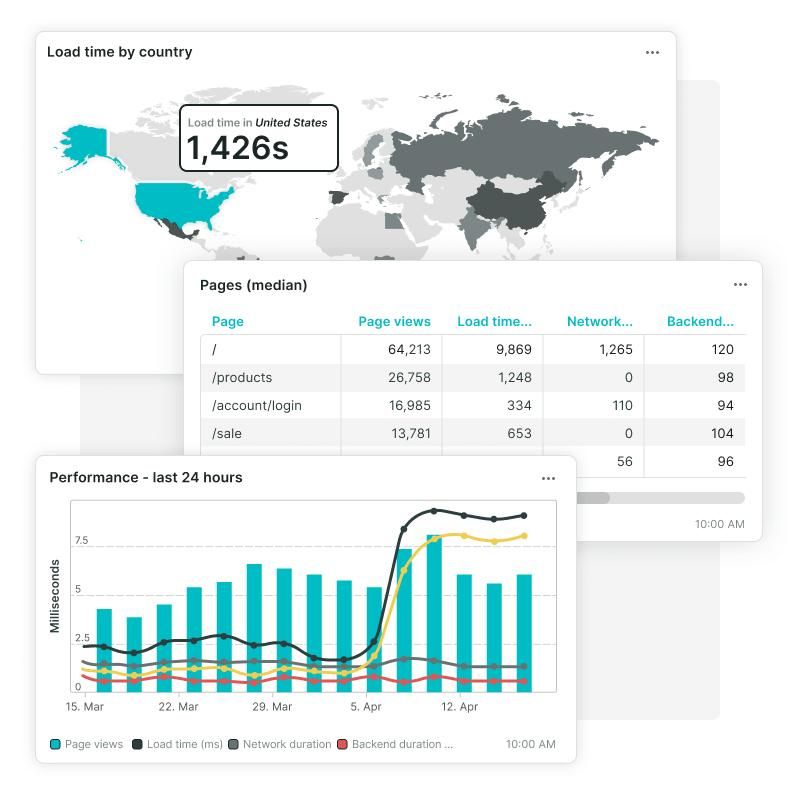
Real user monitoring
Real user monitoring captures actual user interactions.
It tracks how real visitors experience your website across devices, locations, and network conditions. This provides the most realistic view of performance and usability.
Research from Google emphasizes the importance of real-world performance metrics through Core Web Vitals. These metrics are based on real user data and directly influence both user experience and search rankings.
Real user monitoring shows what is happening in the real world, not just in controlled tests.
But even this has limitations. It shows what users experience, but not always why issues occur.
What each method actually detects

Each monitoring method focuses on a different aspect of your website.
Ping and HTTP checks are primarily concerned with uptime and availability. They confirm whether your site is reachable and responsive.
Synthetic monitoring focuses on functionality. It verifies whether specific workflows operate correctly under defined conditions.
Real user monitoring captures user experience. It reflects how performance, speed, and usability impact real visitors.
Individually, each method provides useful data. Together, they create a more complete picture.
But only when they are connected.
What website monitoring tools don’t detect

Even with multiple monitoring methods, there are still critical gaps.
One of the most common issues is broken user flows that fall outside predefined scenarios. Users do not always follow expected paths, and when they deviate, problems can arise that monitoring tools do not catch.
Partial failures are another challenge.
A page might load successfully while a specific component fails. This could be a payment gateway, a form submission, or a dynamic element powered by JavaScript. These failures often go undetected because the page itself appears functional.
Indexing issues are also frequently overlooked.
A website might perform perfectly from a technical standpoint, but if search engines cannot properly index its pages, traffic will decline. Without integration with tools like Google Search Console, these problems remain invisible.
Conversion blockers are perhaps the most costly gap.
Research from Nielsen Norman Group shows that users are highly sensitive to friction. Even small usability issues can significantly reduce conversion rates. Monitoring tools that focus only on uptime and speed miss these deeper experience problems.
This is where tools like Cromojo stand out more clearly. Instead of focusing on a single layer like uptime or basic performance, Cromojo brings together the checks that actually impact business outcomes in one place. Uptime monitoring ensures availability, SSL checks prevent trust and security issues, broken link detection protects navigation and SEO, and Lighthouse audits surface real performance and UX problems. Combined with real-time Slack alerts, this creates a faster feedback loop than many traditional tools that either silo these features or require multiple integrations.
The advantage is not just coverage, but cohesion. You are not stitching together five different tools or waiting for scattered alerts. You get a unified view of your site’s health, which makes it easier to detect patterns, prioritize fixes, and act before issues affect users. From there, adding behavioral insights or analytics complements this foundation rather than compensating for gaps.
Where the real gaps exist
The biggest issue is not the tools themselves, but how they are used.
Most monitoring setups are fragmented. Different tools track different metrics, but they do not communicate with each other.
You might see performance data in one dashboard, error logs in another, and user behavior in a third. Each provides insight, but none provide a complete story.
This fragmentation makes it difficult to identify cause and effect.
For example, a spike in load time might correlate with a drop in conversions, but without connected data, that relationship is not immediately clear.
This is where most teams struggle.
They have data, but not clarity.
Why this matters more than you think

The impact of incomplete monitoring is often underestimated.
When your tools indicate that everything is working, you assume your site is performing well. If conversions drop or engagement declines, you look elsewhere for answers.
Meanwhile, users are experiencing issues.
They may encounter slow load times, broken interactions, or confusing flows. These problems do not always trigger alerts, but they directly influence behavior.
Research from Google shows that as page load time increases from one second to five seconds, the probability of bounce increases by up to 90 percent. This demonstrates how performance issues can significantly affect user engagement.
If you are not monitoring these factors effectively, you are making decisions based on incomplete information.
And when you solve the wrong problems, results do not improve.
Final thoughts
Website monitoring tools are powerful, but only when you understand what they are actually measuring.
Each method provides a different layer of insight. Ping monitoring confirms availability. HTTP checks validate access. Synthetic monitoring tests defined workflows. Real user monitoring captures real-world experience.
But none of these methods are complete on their own.
To truly understand your website, you need to combine these layers and connect the data.
Without that, you are only seeing fragments.
See the full picture, not fragments
Cromojo connects multiple monitoring layers into a unified system, giving you a complete view of your website’s performance.
Instead of relying on isolated tools, you can understand how uptime, performance, indexing, and user behavior interact in real time.
If your website plays a critical role in your business, this level of visibility is essential.
.png)
.png)
.png)